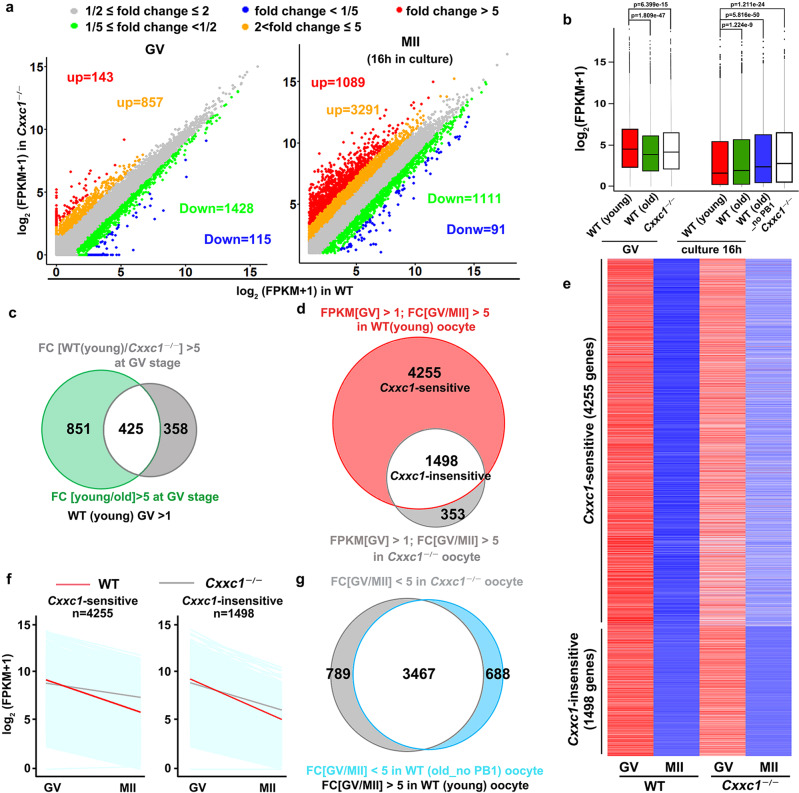
Fig. 6. Meiotic maturation-coupled mRNA decay in Cxxc1-deleted oocytes.
a Scatter plots of RNA-seq data illustrating transcriptional changes in Cxxc1-deleted oocytes in the GV and metaphase II (MII) stages. b Box plot showing gene expression levels of WT (4-week and 14-month) and Cxxc1-deleted (4-week) oocytes before and after in vitro maturation culture. N = 3 biologically independent samples were included in young and old WT GV group, Cxxc1-deleted GV group, old WT MII (with PB1) group and Cxxc1-deleted MII group. n = 2 biologically independent samples were included in WT old MII (without PB1) group. The box indicates the upper and lower quantiles, the thick line in the box indicates the median, and the whiskers represent the 2.5th and 97.5th percentiles. The dots outside the whiskers of the box plot represent the outliers. P-values by a two-tailed Student’s t-test are indicated. c Venn diagram showing the overlap of transcripts that decreased more than 5 fold in WT (14-months) and Cxxc1-deleted oocytes (4-week) compared with WT (4-week) oocytes at the GV stage. d Venn diagram showing the overlap of transcripts that decreased 5 fold from the GV to MII stage in 4 week WT and Cxxc1-deleted oocytes. Transcripts with FPKM > 1 at the GV stage were selected and analyzed. e Heat maps showing level changes in maternal transcripts removed during oocyte meiotic maturation in a Cxxc1-dependent and independent manner. f Degradation patterns of mouse maternal transcripts during GV-MII transition in oocytes derived from 4-week-old WT and Cxxc1oo–/– mice. Each light blue line represents the expression level of one gene, and the middle red and gray lines represent the median expression levels of the cluster. g Venn diagram showing the overlap of M-decay transcripts that were stabilized during in vitro maturation in 14 month WT (no PB) and 4-week Cxxc1-deleted oocytes.

