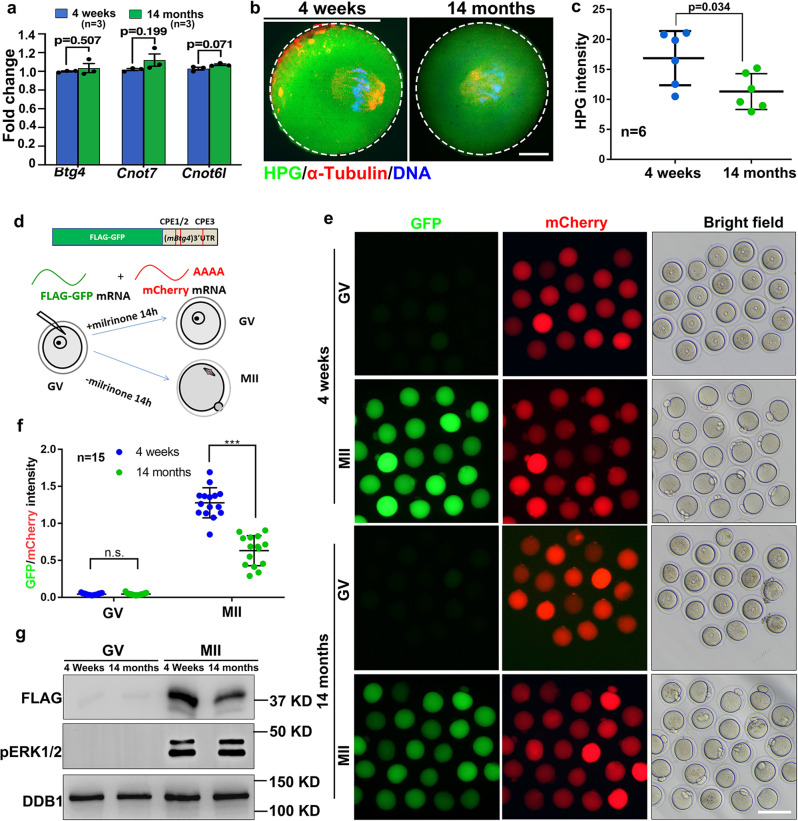
Fig. 7. Age-associated changes of mRNA translation activities in mouse oocytes.
a Quantitative RT–PCR results showing the relative levels of the indicated transcripts in GV oocytes derived from 4-week and 14-month mice. n = 3 biological replicates. data are presented as mean values ± SEM. Statistical analysis was performed using two-tailed Student’s t-test. n.s.: non-significant. b HPG fluorescent staining showing the protein synthesis activity in oocytes derived from 4-week and 14-month mice. Scale bar = 10 µm. c Quantification of HPG signals in (b). n = 6 oocytes for each experimental group. Data are presented as mean values ± SEM. P by two-tailed Student’s t-test. d, f: Illustration (d), fluorescence microscopy (e), quantification of the fluorescent signals (f), and western blot (g) results showing the translation activities of the Btg4 3′-UTR in GV-arrested (maintained by milrinone) or MII-arrested (released from milrinone) oocytes. The GFP signal indicated translational activation of the Btg4 3′-UTR. An in vitro transcribed and polyadenylated mCherry mRNA was co-injected as a positive control. Scale bar: 100 µm (e). n = 15 oocytes for each experimental group. Data are presented as mean values ± SEM. P by two-tailed Student’s t-test (f).

