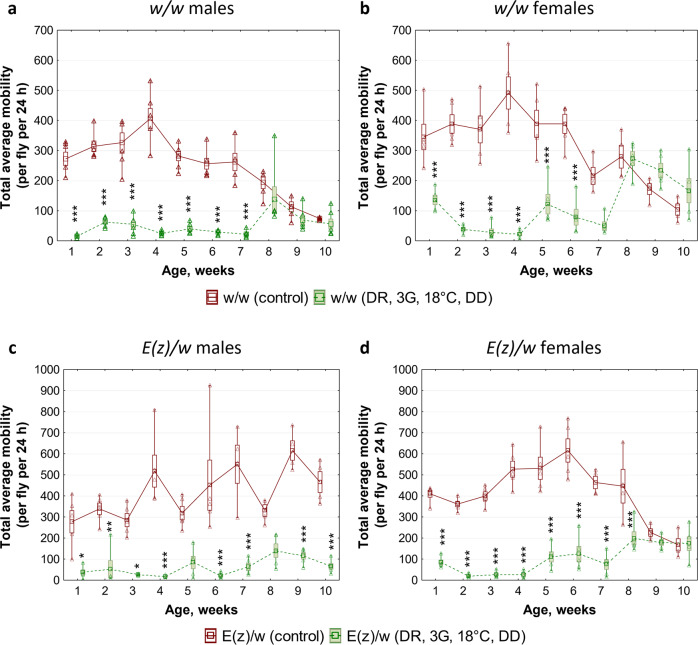
Fig. 3. Effects of a combination of dietary restriction (DR), geroprotectors (3G), low ambient temperature (18 °C), and maintenance in the dark (DD) on age-dependent dynamics of total daily locomotor activity.
a, b Control line w/w. c, d Long-lived line E(z)/w. a, c Males. b, d Females. The plots show individual data points (triangles), means (squares), standard errors (boxes), minimum and maximum values (whiskers). Asterisks (*) indicate the level of statistical significance of differences (*p < 0.05; **p < 0.01; ***p < 0.001, two-way ANOVA followed by post-hoc Tukey’s HSD tests); n = 50 flies. All source data underlying the graphs are presented in the Supplementary Data 1.

