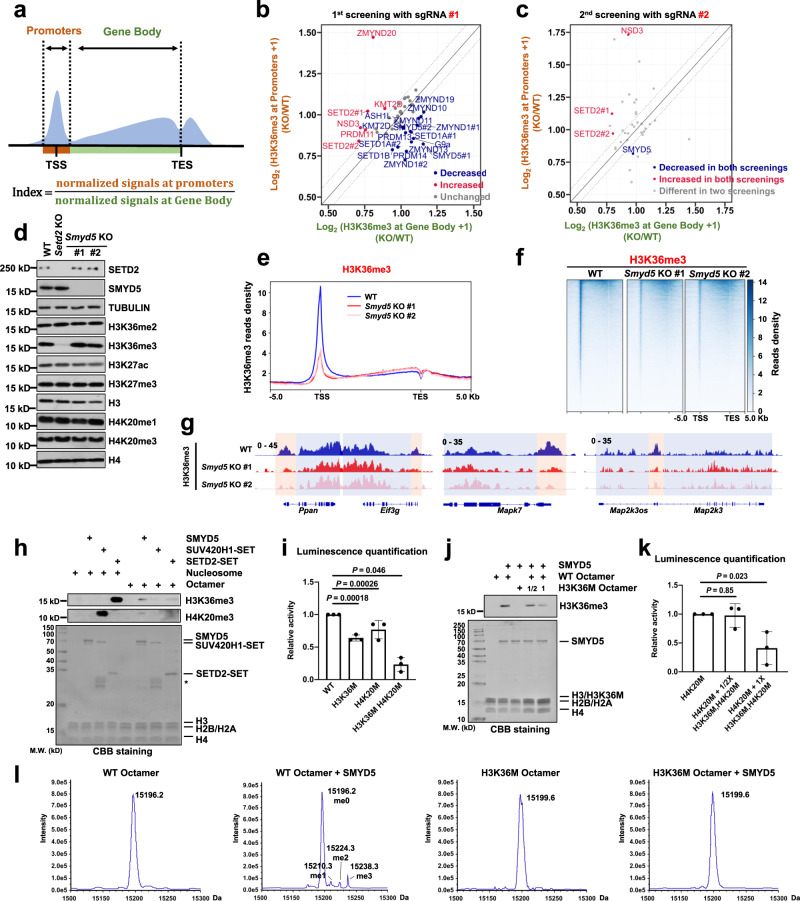
Fig. 2. SMYD5 methylates H3 to H3K36me3.
a Schema showing the calculation of the H3K36me3 index. b Dot plot showing the first screening results. Genes, KO of which changed H3K36me3 indexes less than 15% (gray), decreased or increased the H3K36me3 indexes in blue and red, respectively. c Dot plot showing the second screening results. color scheme as in (b). d Protein levels in WT and Smyd5 KO mESCs. Setd2 KO #1 mESCs were used as a positive control for H3K36me3. Cell extracts were analyzed by Western blotting using the specified antibodies. Two independent experiments were performed. Source data are provided as a Source Data file. e The normalized read distribution profiles of H3K36me3 CUT&Tag spanning 5 Kb of gene bodies in WT and Smyd5 KO mESCs. TSS, transcription start site. TES, transcription end site. f Heatmaps of H3K36me3 levels detected by CUT&Tag around gene body regions in WT and Smyd5 KO mESCs. 5 Kb windows spanning the TSS to TES of all genes determined by NCBI RefSeq were plotted. g IGV tracks presenting the enrichment of H3K36me3 by H3K36me3 CUT&Tag in WT and Smyd5 KO mESCs. Red boxes: promoter regions. Blue boxes: gene body regions. h HMT assays of full length SMYD5, SET domain of SUV420H1, and SET domain of SETD2 proteins against nucleosome or octamer substrates. Upper panel: Western blotting. Lower panel: the input by Coomassie Brilliant Blue (CBB) staining. Each assay was repeated at least three times with similar results. Star indicated the non-specific proteins. i End-point HMT assays of SMYD5 against an equal amount of WT, H3K36M, H4K20M, and H3K36M, H4K20M mutant octamers. N = 3 independent experiments. Data are mean ± SD. P values were calculated by one-way ANOVA. j HMT assays of full length SMYD5 against different amounts of WT and H3K36M octamer substrates. Upper panel: H3K36me3 western blot. Lower panel, input by Coomassie Brilliant Blue (CBB) staining. Each assay was repeated at least three times with similar results. Source data are provided as a Source Data file. k End-point HMT assays of SMYD5 against the different amounts of H4K20M and H3K36M/H4K20M octamers. N = 3 independent experiments. Data are mean ± SD. P values were calculated by one-way ANOVA. Source data are provided as a Source Data file. l ESI-TOF mass spectrometry analysis of Histone H3.

