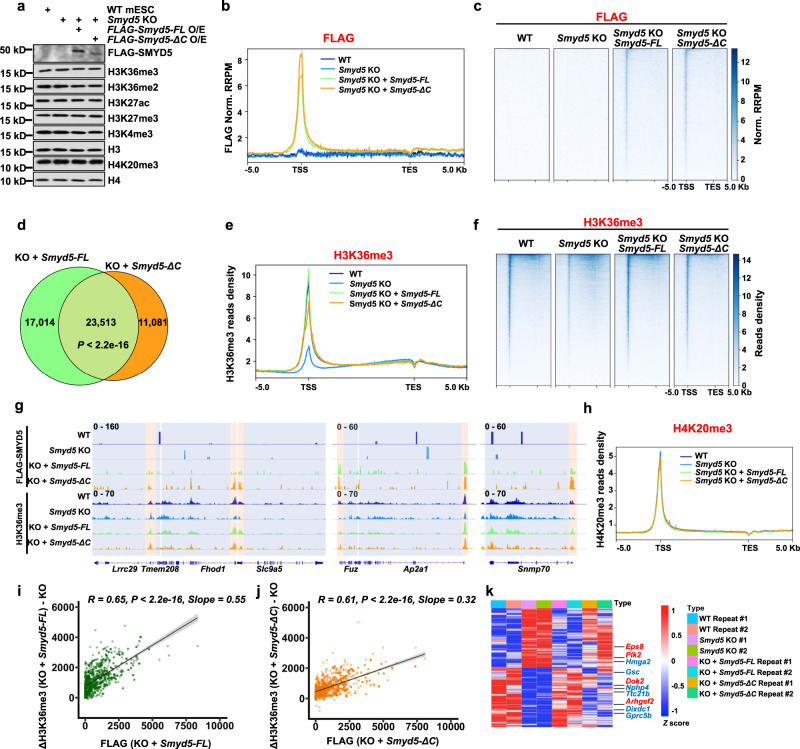
Fig. 6. Overexpression of Smyd5 but not Smyd5-ΔC rescues H3K36me3 and gene expression in Smyd5 KO cells.
a Overexpression of Smyd5 in Smyd5 KO mESCs didn’t change the total levels of tested histone marks. Smyd5 KO mESCs were transfected with full length (FLAG-Smyd5-FL) or C-terminal deletion (FLAG-Smyd5-ΔC) Smyd5 overexpression plasmids. Cell extracts were analyzed by Western blotting using the indicated antibodies. Two independent experiments were performed. Source data are provided as a Source Data file. b Normalized read distribution profiles of FLAG-SMYD5 as detected by FLAG CUT&Tag. c Heatmaps illustrating FLAG-SMYD5 levels detected by FLAG CUT&Tag around gene body regions. d Venn diagram showing the overlap of overexpressed full length and C-terminal deleted SMYD5. P value was determined by Fisher’s exact statistical test, two-sided. KO, Smyd5 KO. e Normalized read distribution profiles of H3K36me3 CUT&Tag signals. f Heatmaps illustrating H3K36me3 levels around gene body regions. g IGV tracks presenting the enrichments of FLAG-SMYD5 and H3K36me3 by CUT&Tag. Three different chromatin loci were shown. Red boxes indicated the promoter regions. Blue boxes indicated gene body regions. h The normalized read distribution profiles of H4K20me3 CUT&Tag signals. i The difference in normalized read densities of H3K36me3 at promoters between Smyd5 KO and Smyd5 reexpression mESCs relative to that of FLAG-SMYD5. R, correlation coefficients that were assessed by Pearson product moment correlation. Confidence interval shows the SEM. Source data are provided as a Source Data file. j Same as in (h), except Smyd5 KO mESCs with FLAG-Smyd5-ΔC overexpression were used. Confidence interval shows the SEM. Source data are provided as a Source Data file. k Gene expression heatmap for genes that were restored in FLAG-Smyd5-FL reexpression mESCs. All the changed genes between WT and Smyd5 KO cells that were ‘rescued’ by the WT Smyd5 transgene were plotted. Genes associated with Ras signaling were labeled as red. Genes associated with Wnt signaling were labeled as blue. Two repeats of each sequencing were shown. Source data are provided as a Source Data file.

