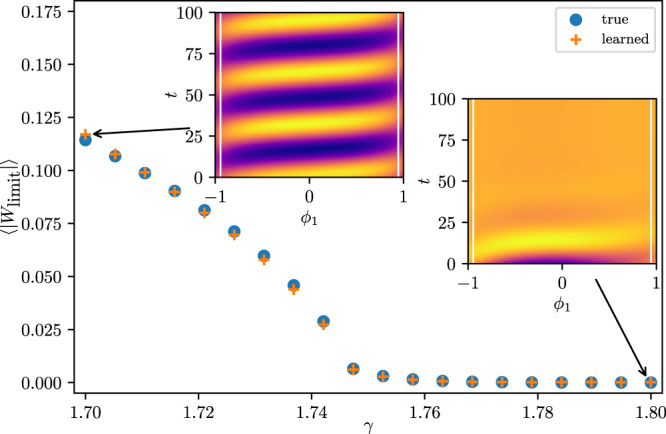
Fig. 4. Computational bifurcation diagram by plotting the mean amplitude 〈∣Wlimit∣〉 averaged over the ensemble at the limit set.

In particular, we integrate from random initial conditions close to the limit set for T = 10000 dimensionless time units for the Stuart-Landau ensemble (blue circles) and the learned PDE (orange crosses). A mean amplitude near zero indicates convergence to the fixed-point W = 0 ∀ ω, whereas a non-zero 〈∣Wlimit∣〉 indicates oscillations with finite amplitude. The color codings of the insets show the real part of the complex variable W obtained from integrating an initial condition close to the fixed point Wk = 0 with γ = 1.8 (right inset) and close to the limit cycle with γ = 1.7 (left inset) using the learned model and employing explicit forward Euler for γ = 1.8 > γH.
