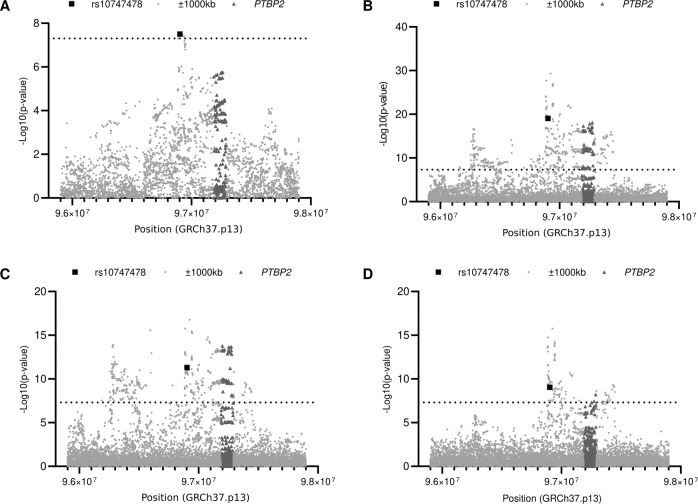
Fig. 2. Plots of the chromosomal location and p values of variants located near rs10747478 (±1000 kb) on BMI GWAS and AN GWAS data.
Variants were extracted from Pulit et al. BMI GWAS [11] and Watson et al. AN GWAS [10]. A: AN, B: BMI (combined sexes), C: BMI males, D: BMI females. The −log10(p value) for the association are shown on the y-axis and the chromosomal locations are ordered on the x-axis. The variants which surpassed the dashed line are genome-wide significant. Light gray dots indicate ±1000 kb genomic region of rs10747478, black square pointed to SNP rs10747478, and variants located in the PTBP2 genomic region plotted with dark gray triangles.

