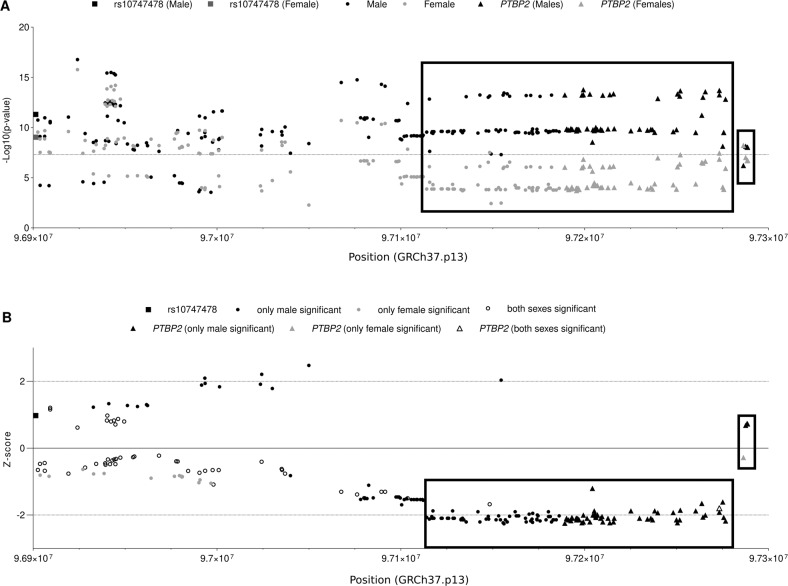
Fig. 3. Differences between effect sizes and p values in females and males.
Variants located in the genomic region from rs10747478 to the PTBP2 gene were extracted from sex-stratified Pulit BMI GWAS [11] with a significant p value (p value < 5 × 10⁻⁸) in at least in one sex. A Plots of position and p values (for males and females), B Plots of Z-score of variants. A negative Z-score shows a larger effect for males than females (effect difference = betafemale − betamale). The variants with MAF larger than 0.42 were excluded. Dots indicate the variants located between rs10747478 and the PTBP2 gene, triangles point to the variants located in the PTBP2 gene and the SNP rs10747478 was plotted with a square. Colors are corresponding to the significance of variants: gray = only significant in females; black = only significant in males; white = significant in both sexes. Boxes indicate two putative clusters in strong LD.

