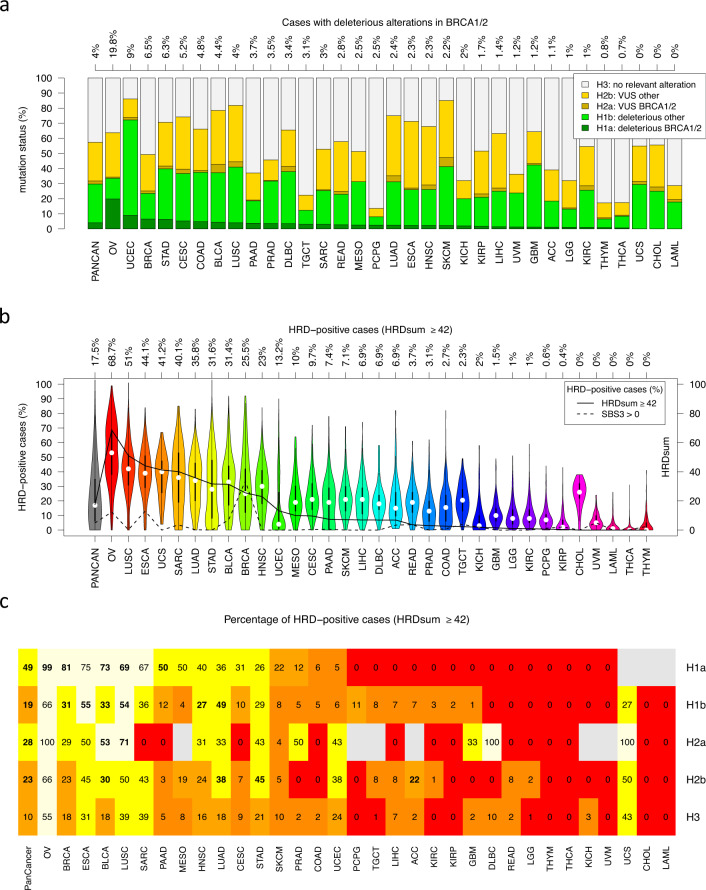
Fig. 1. Pan-cancer analysis of HRR gene mutations and genomic scar signatures (TCGA cohort).
a Tumors with deleterious alterations in BRAC1/2 (H1a), in other HHR genes (H1b), VUS in BRCA1/2 (H2a) and in other HRR genes (H2b). b Distribution of the HRDsum score and percentage of cases classified as HRD-positive by HRDsum (cutpoint: 42) and by SBS3 (cutpoint: 0). HRDsum was calculated starting from genotyping data (SNP arrays). c Percentage of HRD-positive (HRDsum ≥ 42) tumors in the five classes H1a-H3 (grey = no cases). Significant enrichments of HRD-positive tumors compared to H3 are shown in bold face.

