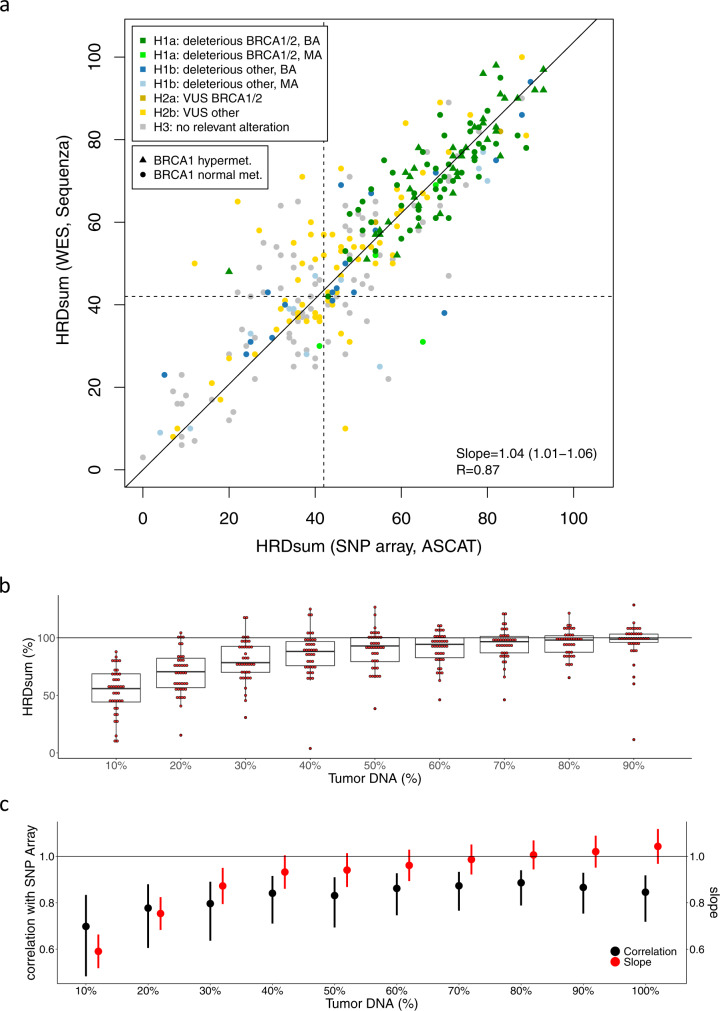
Fig. 6. Validation of HRDsum scores calculated from WES for the TCGA ovarian carcinoma cohort.
a Correlation of HRDsum between WES and SNP array data. Each tumor is colored according to the HRR gene mutation class H1-H3. Linear fit with intercept fixed at zero. R = Pearson correlation. b/c Analysis of the influence of tumor purity on determination of HRDsum by WES. In silico dilution series including 10%, …, 100% reads from the tumor DNA samples and 90%, …, 0% of the reads from the normal DNA samples. b HRDsum scores of the diluted samples expressed as percentages of the corresponding undiluted samples. Box-plot elements show the 5%, 25%, 50%, 75% and 95% quantile of the distribution of HRD scores. c Comparison between HRDsum scores of WES and SNP arrays by Pearson correlations and by fitting linear models without intercepts fixed at zero. Pearson correlations and slopes are shown including 95% confidence intervals.

