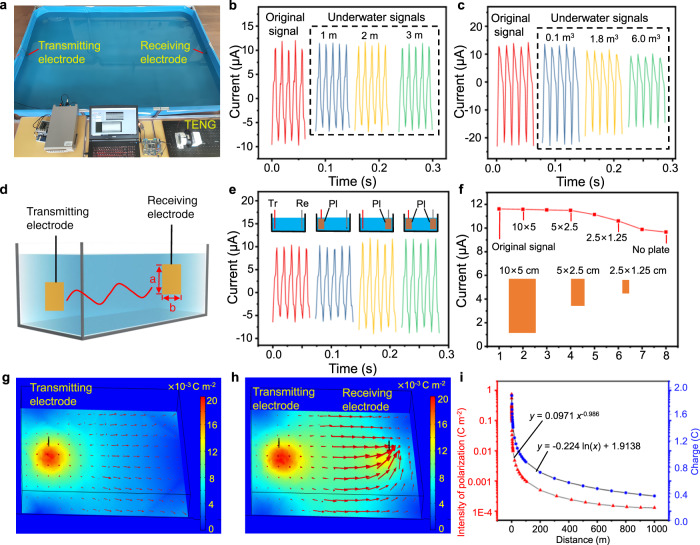
Fig. 3. The transmission performance of the underwater electric field.
a A photo of the experiment. b Comparison between the original TENG short-circuit current and received current signals in water. c Comparison between the original short-circuit current of the TENG and received signals under different water volume. d Schematic diagram of the electrode. e Comparison of the current signals received in water with different transmitting and receiving electrodes. Tr, Re, and Pl represents transmitting electrode, receiving electrode, and electrode plate respectively. f Comparison of the peak values of the received current signals with different receiving electrodes. Simulation diagram of the distribution of polarization electric field (g) without and (h) with the receiving electrode. Color represents polarization intensity. i Variation of polarization electric field and charges on the receiving electrode with the distance between the two electrodes.

