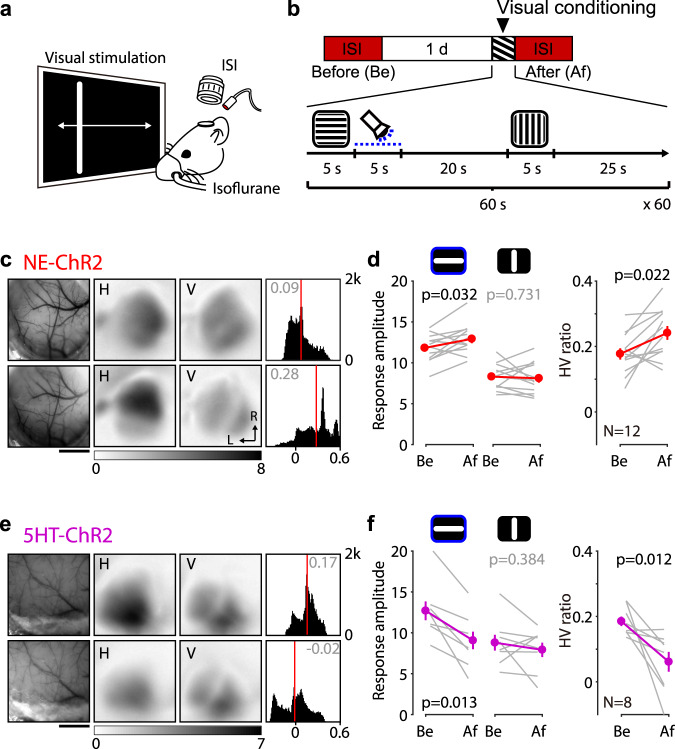
Fig. 1. Potentiation and depression of visual cortical responses by the retroactive action of norepinephrine and serotonin.
a Schematic of the optical imaging of the intrinsic signal (ISI) of the visual cortical response from the V1. b Experiment timeline (top) and the visual conditioning protocol (bottom). Blue dotted line indicates photoactivation of ChR2. c, d Optogenetic transformation of LTP trace induces potentiation of the associated visual cortical response of the NE-ChR2 mice. c Representative change of the visual cortical response by the visual conditioning. Left: vasculature pattern of the imaged region used for alignment. Scale bar, 1 mm. Middle: magnitude map of the visual cortical response evoked by horizontal [H] or vertical [V] drifting bar. Gray scale (bottom): response magnitude as the fractional change in reflection x104. Arrows: L lateral, R rostral. Right: histogram of HV ratio illustrated in the number of pixels (x-axis: HV ratio, y-axis: number of pixels). d Summary of changes in response amplitude evoked by the horizontal (left) or vertical (middle) drifting bar as well as the change of HV ratio (right) before (Be) and after (Af) the conditioning. Thin line: individual experiments; thick line and symbols: average ± s.e.m. e, f Optogenetic transformation of LTD trace induces depression of the associated visual cortical response of the 5HT-ChR2. Same format with (c and d). Source data are provided as a Source Data file.

