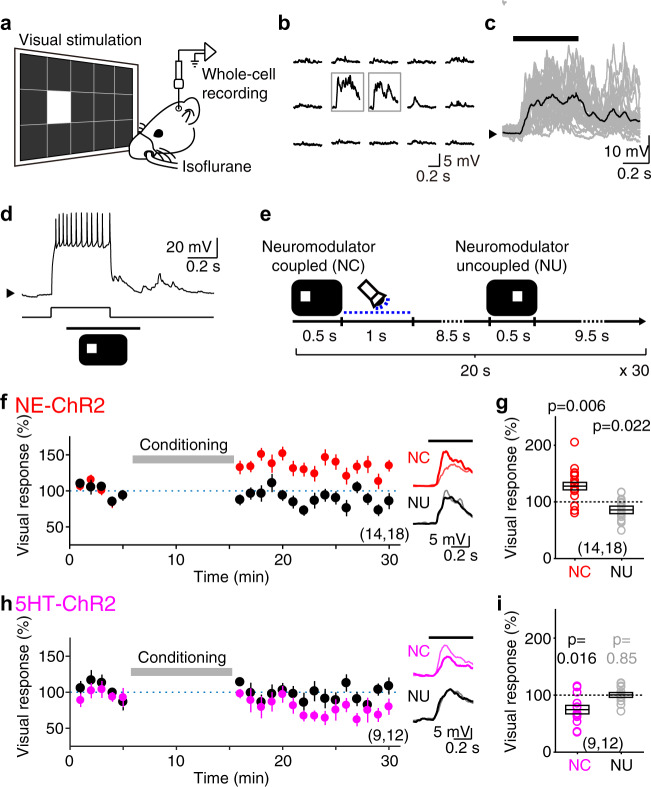
Fig. 3. Potentiation and depression of VEPSPs by Hebbian induction and optogenetic conversion of eligibility traces.
a Schematic of in vivo whole-cell patch-clamp recording of the superficial V1 neurons. b Example of the VEPSPs elicited by visual stimuli at each subregion of a screen. Gray boxes indicate the two panels chosen for visual stimulation. c Individual (gray traces) and averaged (black trace) VEPSPs elicited by the visual stimulus presentation (black bar on top) of a representative neuron. Black arrow on the left indicates Vm (−70 mV). d Pairing of VEPSP with a burst of postsynaptic spikes. The current injected via recording pipette and the timing of visual stimulus are shown at the bottom. Black arrow on the left indicates Vm (−70 mV). e Visual conditioning protocol. f Normalized change of the NC (red) or NU (black) VEPSP amplitude of the NE-ChR2 mice by the visual conditioning. Inset traces show the VEPSPs of a representative neuron averaged initial (thin line) or last (thick line) 5 min of the recording. g Summary of VEPSP changes by the visual conditioning. Box plot: average ± s.e.m. Sample number indicates the number of animals and the number of recorded neurons. h, i Same as panel (f, g) but for the 5HT-ChR2 mice. Source data are provided as a Source Data file.

