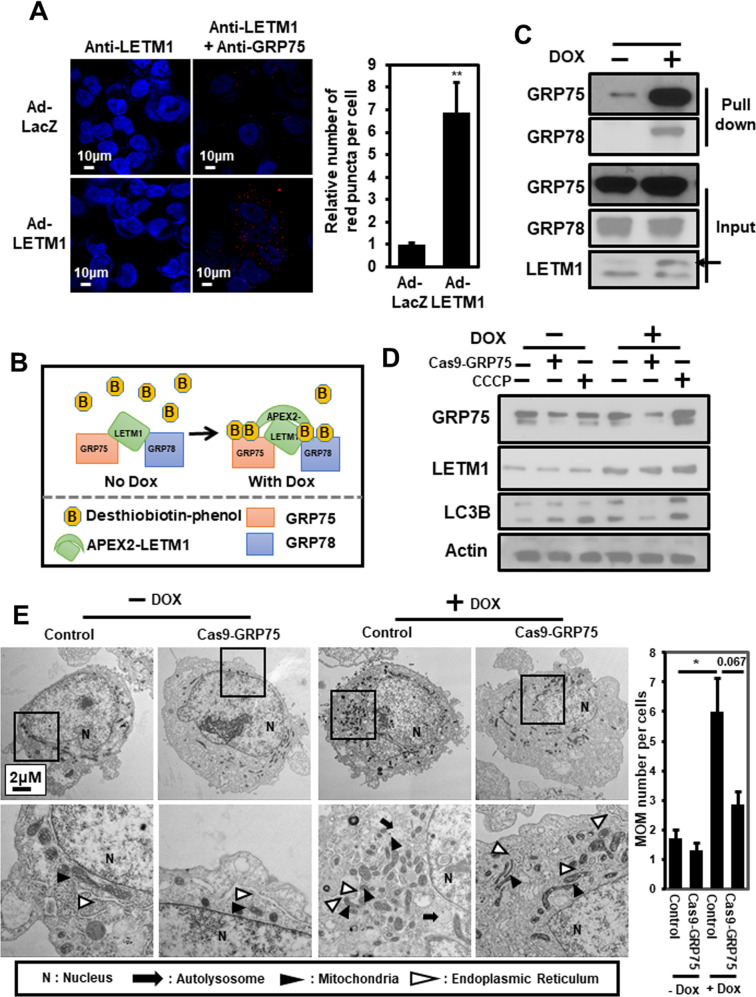
Fig. 6. Effects of glucose-regulated protein 75 kDa (GRP75) on LETM1-mediated autophagy.
A H460 cells were seeded on coverslips and then infected with Ad-LacZ or Ad-LETM1 for 24 h. The cells were incubated with anti-LETM antibody alone, or anti-LETM1 and anti-GRP75 antibodies, followed by a Duolink PLA. The interaction is represented by the red signal under confocal microscopy (left panel) and quantification of red puncta per cell (right panel). B Schematic showing the procedure for the desthiobiotin-phenol (DBP) labeling experiments. C LETM1-APEX2 in stable HEK293 cells were treated with doxycycline for 24 h, followed by the DBP labeling experiment as described in the Material and Methods. DBP-GRP75 and DBP-GRP78 were pulled down by streptavidin beads and detected by western blotting. The arrow points APEX2-LETM1 band. D H460/Tet-On-inducible LETM1 cells were seeded onto 10-cm plates overnight. CRISPR/Cas9-GRP75 plasmid was used to knock down GRP75. LETM1 expression was induced by incubating the cells with 100 ng/ml doxycycline for 24 h. For the positive control, cells were treated with 30 μM CCCP for 8 h. The cells were lysed and analyzed by western blotting with the indicated antibodies. These results are representative of three independent experiments. E CRISPR/Cas9-GRP75 plasmid was used to knock down in H460/Tet-On-inducible LETM1 cells. For the positive control, cells were treated with 30 μM CCCP for 8 h. These cells were analyzed by transmission electron microscopy. Scale bars represent 2 μM. N: nucleus; block arrows; autophagosomes; arrowheads: mitochondria; white arros; ER; The quantification graph was calculated from 7 different cells each condition. Mitochondrial-ER association point was counted per single cell. *p < 0.05.

