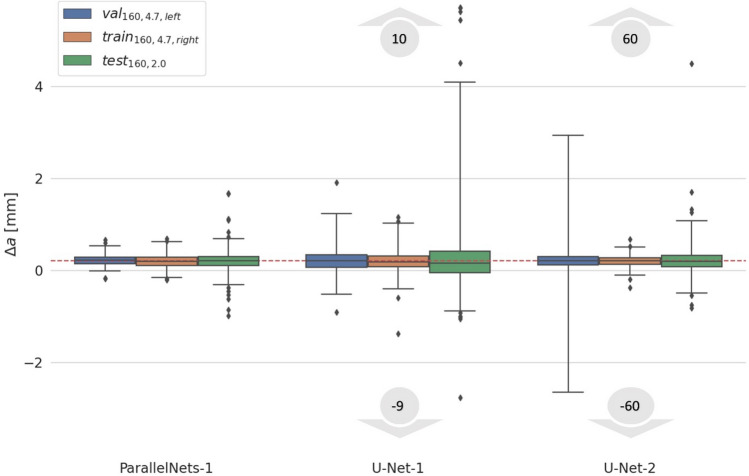
Figure 5.
Stability of crack detection models between subsequent steps at maximal force. The target baseline for is 0.2 mm depicted as a red dashed line. Quartiles (25–75%) are shown as colored boxes. The vertical black-line intervals indicate the 1–99% quantiles. Diamonds show outliers. For the models U-Net-1 and U-Net-2 these outliers actually range from − 9 to 10 and − 60 to 60 mm, respectively, and partially lie outside the plotted range.

