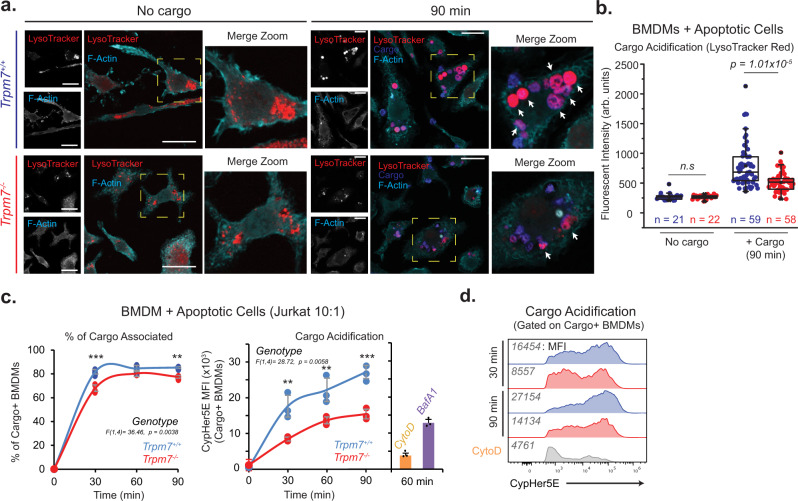
Fig. 3. TRPM7 is required for acidification of apoptotic cells during efferocytosis.
a Confocal immunofluorescence microscopy of BMDMs with or without addition of apoptotic cells as cargo for phagocytosis. Apoptotic cells were labelled with CellTrace Violet (Cargo-blue) and live BMDMs were stained with LysoTracker (red) prior to PFA-fixation and then phalloidin stained (cyan) after fixation. Single-channel images of LysoTracker and F-actin (phalloidin) are shown with merged pseudocolored image. Yellow dotted box indicates zoomed ROI of adjacent image and arrows indicate phagolysosomes. Single optical sections (0.45 μm) are shown. Scale bar = 20 μm. Representative images are from three independent experiments. b Quantification of LysoTracker fluorescent intensity, as shown in panel a. Data points represent intensity measurement for single phagocyte; n values for each condition are included in the figure. The parameters included in box charts are described in the methods. c Flow cytometry-based measurement of phagocytosis of apoptotic Jurkat cell cargo by BMDMs (J:B = 10:1) over time. Cargo were stained with CellTrace Violet and CypHer5E prior to adding to BMDMs at level indicated in figure. Engulfing BMDMs were gated for anti-mCD45 antibody staining prior to the measurement of CellTrace Violet and CypHer5E staining. Control samples with Cytochalasin D (1 μM) and Bafilomycin A1 (500 nM) were pretreated 15 min prior to the addition of AC cargo. Data points represent n = 3 independent samples, and the data are representative of three independent experiments. Error bars represent SD centered on mean. d Representative histograms of data in panel c. Mean fluorescent intensity values are as indicated on figure panel. Representative of n = 3 independent samples. Source data are provided as a Source Data file, and statistical testing is described in “Statistics and Reproducibility”.

