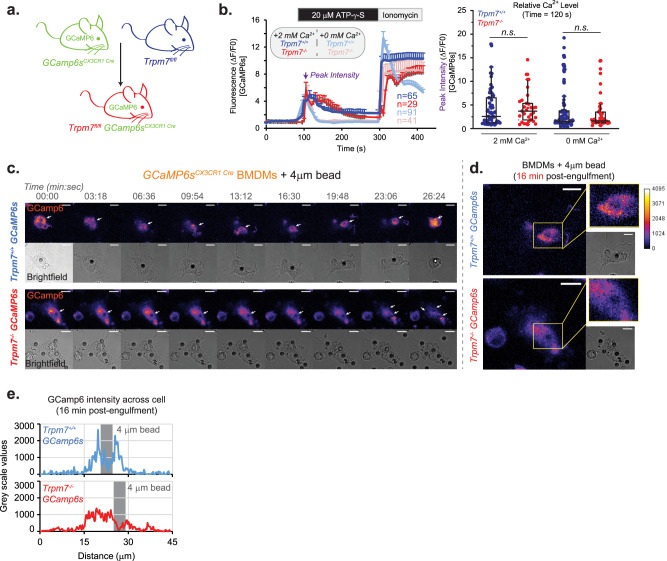
Fig. 8. Phagocytosis of apoptotic cells triggers phagosome-proximal elevations in Ca2+.
a Generation of TRPM7 WT and KO GCaMP6s-expressing mouse strains is schematized. b Relative changes in [Ca2+]i, as depicted by GCaMP6s-fluorescence, in response to ATP over time in GCaMP6s-expressing BMDMs. Cells were treated with 20 μM ATP-γ-S for 3 min in bath solution containing either 0 or 2 mM Ca2+, as indicated. Ionomycin (2 μM) was added as a positive control. Left: Mean GCaMP6s intensity over time (n values shown in the figure); error bars represent SEM. Right: Quantification of peak GCaMP6s-fluorescence intensities after ATP-γ-S addition, at the timepoint indicated by an arrow in the left panel; Each data point in the box chart reflects a cell. The mean value is depicted by a solid horizontal line across the box. c Changes in [Ca2+]i during phagocytosis in GCaMP6s-expressing WT (top) and KO BMDMs (bottom) during phagocytosis of 4 μm carboxylated beads. Arrow indicates bead-containing phagosome. GCaMP6s-fluorescence (top image; Fire LUT) and brightfield (bottom image; gray) were acquired via confocal microscopy and single optical section (0.5 μm) is shown. Scale bar is 10 μm. d Periphagosomal [Ca2+]i in WT and KO BMDMs is shown as a magnified image from panel a, 16 min post-engulfment. GCaMP6s-fluorescence (fire) and brightfield (gray) are shown with ROI highlighted (yellow box). Relative scale of GCaMP6s intensity is show on the right. Scale bar is 10 μm. e Measurement of [Ca2+]i derived from a line scan analysis from cells depicted in panel b. Fluorescent intensity of GCaMP6s was measured across the length of the cell through the indicated phagosome in a single x–y plane line trace. Bead location indicated by gray column. Source data are provided as a Source Data file, and statistical testing is described in “Statistics and Reproducibility”.

