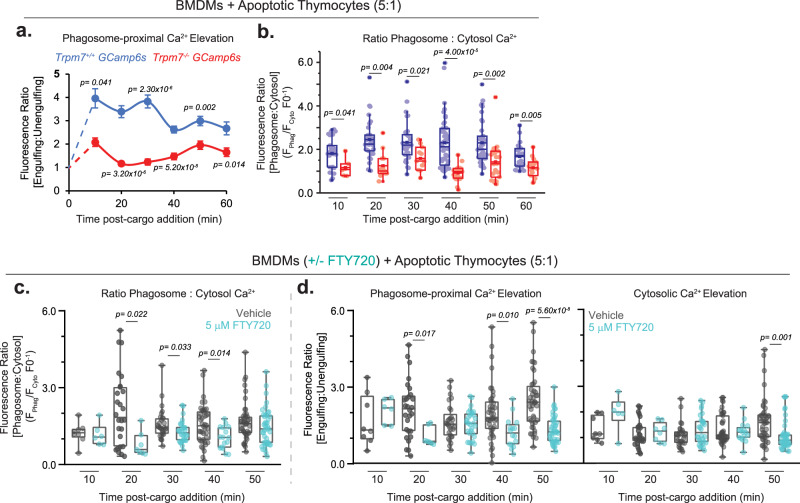
Fig. 9. Phagosome-proximal elevations in Ca2+ are dependent on TRPM7 during efferocytosis.
a Measurement of phagosome-proximal [Ca2+] in WT and KO BMDMs during phagocytosis of apoptotic cells. Changes in fluorescence of GCaMP6s represent changes in phagosome-proximal Ca2+. Data points were collected at indicated time points and measure the MFI in cargo-containing BMDMs relative to the fluorescence of non-engulfing BMDMs in the same field of view. Data points depict mean values; error bars reflect SEM (n > 20 cells at each timepoint). Individual data points are plotted in Supplementary Fig. 6e (left), and statistics were tested at each measured timepoint between genotypes. b Relative changes in phagosome-proximal [Ca2+] during phagocytosis in WT and KO BMDMs. Phagosome-proximal values are relative to the cytoplasmic [Ca2+] within the same cell. Data were measured from the same experiments shown in panel a. Fluorescence ratio reflects fluorescence intensity in an ROI proximal to phagosome relative to the cytosol ROI. Analysis is described in Supplementary Fig. 6a-c and Methods. Data points in the box chart represent individual phagosomes and the mean value is depicted as a horizontal line across the box. See also Supplementary Fig. 6d, e. c Relative changes in phagosome-proximal cytosolic [Ca2+] during phagocytosis with and without treatment with FTY720. Data are as displayed in Fig. 9b. d Relative changes in phagosome-proximal and cytosolic [Ca2+] during phagocytosis with and without treatment with FTY720. Data are displayed as in Fig. 6f, data points in the box chart represent individual phagosomes and the mean value is depicted as a horizontal line across the box. See also Supplementary Fig. 9c. Source data are provided as a Source Data file, and statistical testing is described in “Statistics and Reproducibility”.

