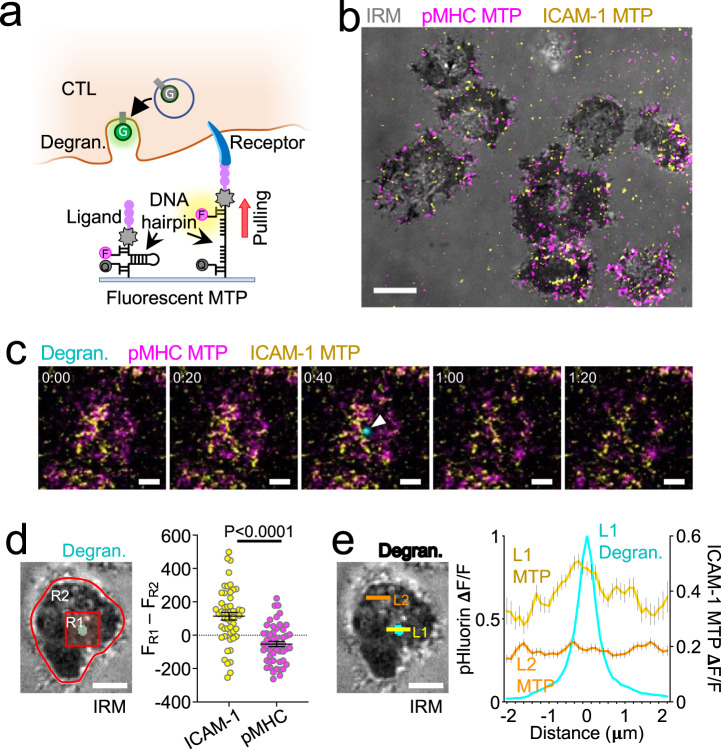
Fig. 5. LFA-1 pulling forces define degranulation domains.
a Measuring correlations between degranulation (Degran.) and receptor-specific pulling forces with MTPs. F fluorophore, Q quencher, G pHluorin. b–e OT-1 CTLs expressing pHluorin-Lamp1 were imaged by TIRF microscopy on glass surfaces coated with pMHC (H-2Kb-OVA) and ICAM-1 MTPs. b Representative image of pMHC-MTP and ICAM-1-MTP signals, overlaid onto the corresponding IRM image. Scale bar = 5 μm. c Time-lapse montage showing a representative degranulation event (indicated by a white arrowhead) together with pMHC-MTP and ICAM-1-MTP signals. Time in M:SS is shown at the top left corner of each image. Scale bars = 2 μm. d Left, image of a representative degranulation event, overlaid onto the corresponding IRM image. Regions defining the degranulation subdomain (R1) and the entire IS (R2) are indicated. Scale bar = 2 μm. Right, differences in mean fluorescence intensity between R1 and R2 at the moment of degranulation are shown for the indicated MTPs. N = 52 for each sample. Error bars signify SEM. P value calculated by unpaired, two-tailed Student’s t test. e Left, the image of a representative degranulation event, overlaid onto the corresponding IRM image. Linescans sampling the degranulating (L1) and inactive (L2) domains are indicated. Scale bar = 2 μm. Right, normalized ICAM-1-MTP fluorescence along L1 and L2 at the moment of degranulation (see “Methods”). The pHluorin-Lamp1 (Degran.) signal along L1 is shown for reference. Error bars signify SEM. N = 122 cells, pooled from two independent experiments. All other data are representative of at least two independent experiments. Source data are provided as a Source Data file.

