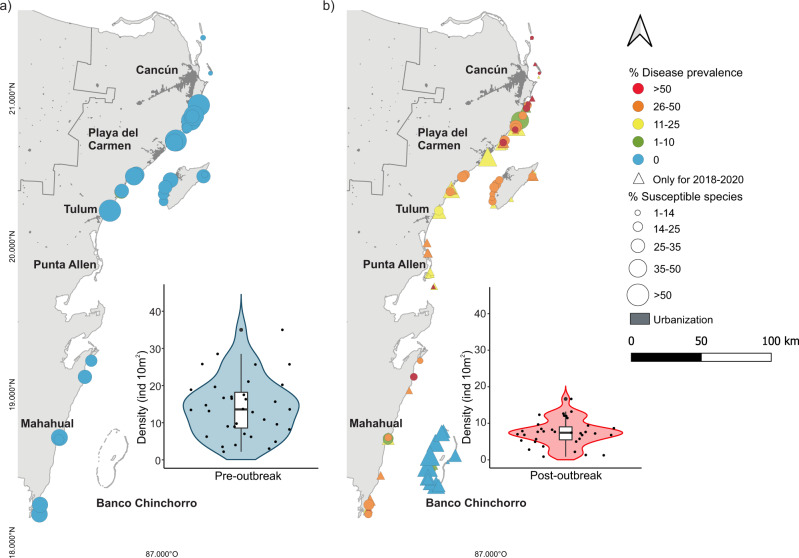
Fig. 2. Prevalence of stony coral tissue loss disease (SCTLD) in highly susceptible species in the Mexican Caribbean.
a White plague-type disease prevalence in species highly susceptible to SCTLD in 35 sites surveyed before the outbreak of the disease (2016 and 2017). b SCTLD prevalence (i.e., diseased and recently deceased colonies) in highly susceptible species during or after the SCTLD outbreak (2018 and 2020). In (a) and (b), the circles represent the locations of the reefs that were sampled before and after the outbreak. The triangles represent the sites that were only surveyed during or after the outbreak. The size of the figure indicates the percentage of healthy colonies of highly susceptible species based on the total number of surveyed colonies at each site and time period (including all coral species). The insets in (a) and (b) represent the distributions of the densities of live coral colonies of highly susceptible species across all surveyed sites for each period. The data points represent each surveyed site, and the box plots depict the median (horizontal line), the first and third quartiles (box height), and 95th percentiles (whiskers). The shaded area (violin plot) depicts the kernel density showing the probability of the data at different values. Highly susceptible species are those with more than 10% disease prevalence (see Methods and Fig. 1).

