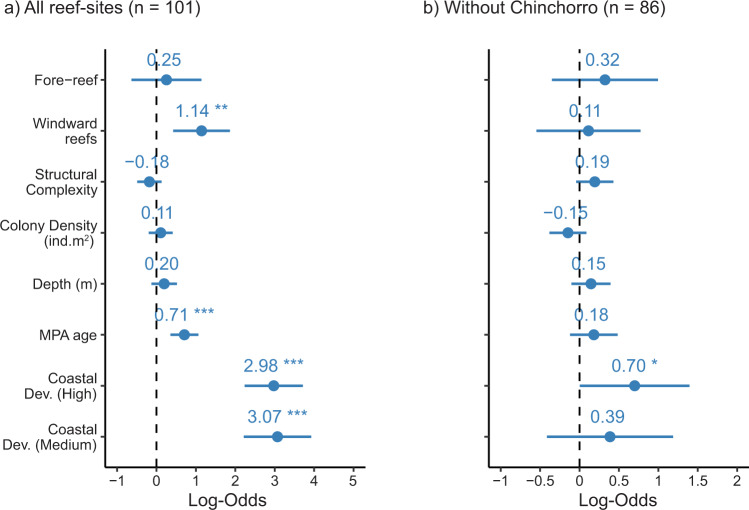
Fig. 3. Disease prevalence predictors in coral reefs in the Mexican Caribbean.
a Disease prevalence predictors for 101 reef sites in the Mexican Caribbean and (b) without the Banco Chinchorro reefs (86 sites). Effect sizes are the logistic mixed models with the dots and lines representing the means and 95% confidence intervals, respectively. All continuous predictive variables were scaled to z-scores with the scale function in R. In the model, categorical variables, such as coastal development (low), leeward reefs, and back-reefs, were used as arbitrary references. Asterisks denote statistical differences (*p < 0.05, **p < 0.01, ***p < 0.001).

