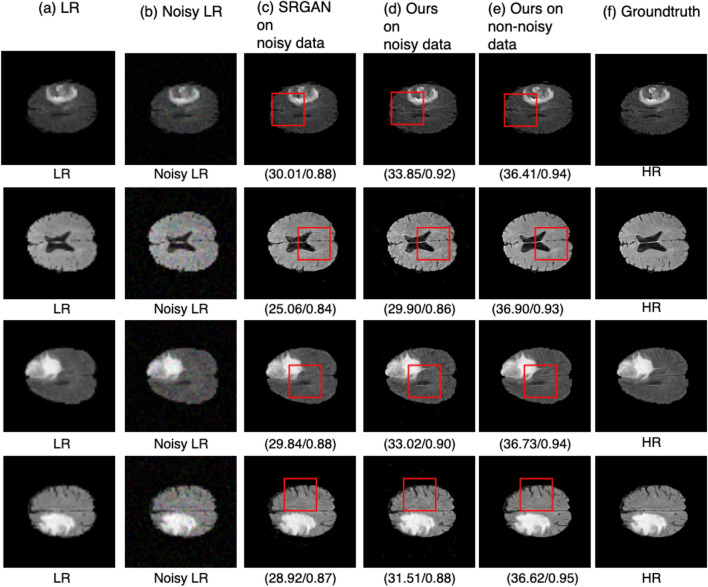
Figure 14.
Results of super resolution for noisy MRI images. Column (a) shows the LR images ( but scaled for uniform display), Column (b) shows the noisy LR images ( but scaled for uniform display), column (c) shows the results for SRGAN31, column (d) shows the results for the proposed architecture, column (e) shows the results of proposed method on non-noisy images, column (f) shows ground truth HR images (). Each row illustrates result of a single image. (SSIM/PSNR) score is shown for each image. Red box illustrates the degradation or improvement caused by each algorithm w.r.t ground truth HR image.

