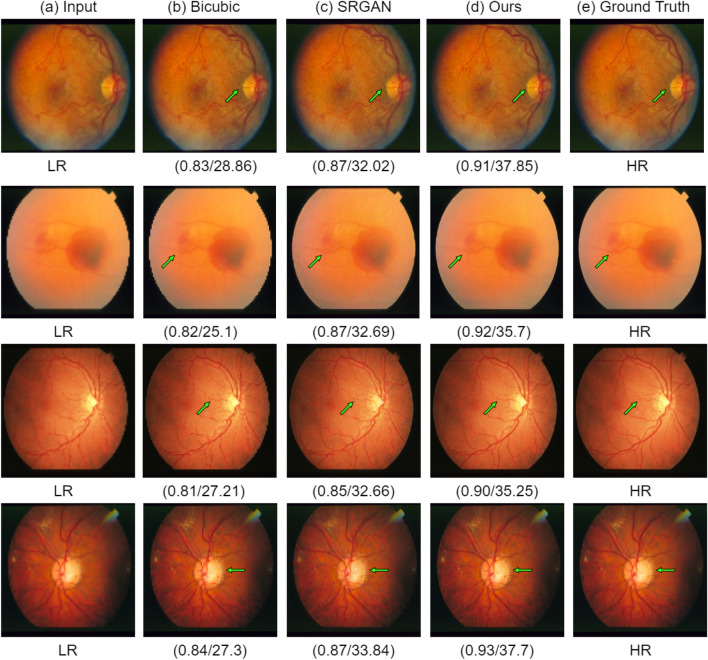
Figure 6.
Results of super resolution for different images of STARE dataset. The column (a) has LR images (128128 but scaled for uniform display), column (b) shows Bicubic interpolation SR result, column c shows output HR images for SRGAN31, column d shows output HR images for the proposed architecture, column e shows ground truth HR images (512512). Each row illustrates results of a single image. The corresponding (SSIM/PSNR) scores are mentioned below each image. Green arrows illustrate the degradation or improvement caused by each algorithm with respect to the ground truth HR image.

