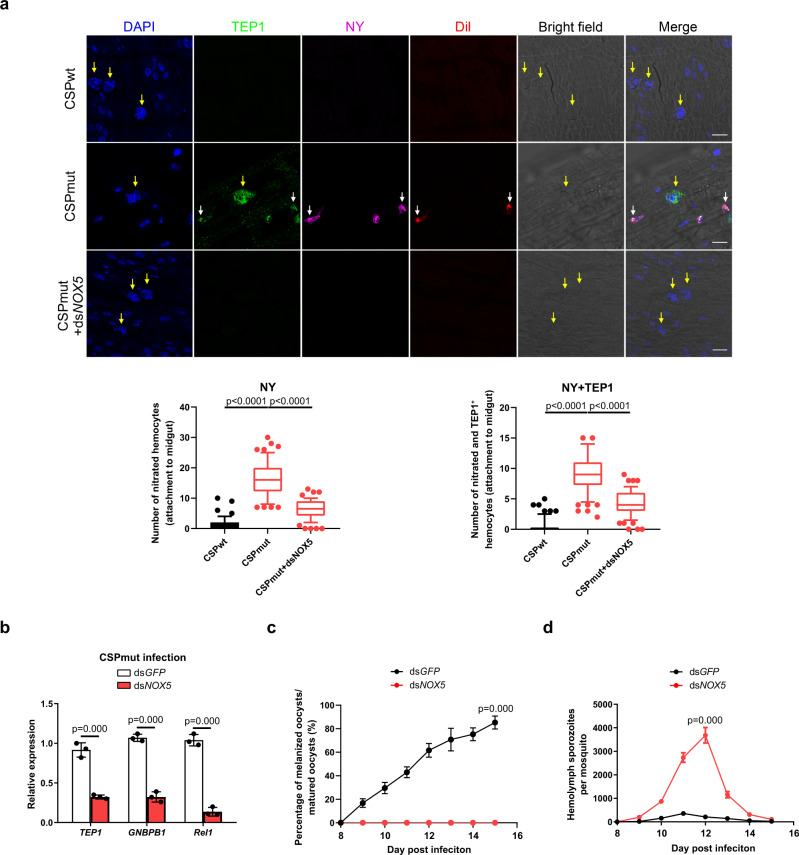
Fig. 4. CSPmut triggers mosquito immune responses through the induction of hemocyte nitration.
a Representative image of the nitration and TEP1 expression of hemocytes around oocysts in Plasmodium yoelii CSPwt or CSPmut parasite-infected mosquitoes at day 4 after NOX5 was knocked down or not. This was determined by the detection of nitrotyrosine (NY), TEP1, and Vybrant CM-DiI (Dil); scale bar 50 μm (upper), and the numbers of nitrated hemocytes and TEP1-positive nitrated hemocytes attached to midguts (n = 60) were statistically analyzed (low). Yellow arrow indicates either WT or mutant oocysts; white arrow indicates hemocytes. b The relative expression of TEP1, GNBP-B1, and Rel1 in P. yoelii CSPmut parasite-infected mosquitoes (n = 15) at day 5 PI after NOX5 knockdown. c The percentage of melanized mature oocyst in P. yoelii CSPmut parasite-infected mosquitoes (n = 36) at the indicated time points after NOX5 knockdown. d The average number of hemolymph sporozoites in P. yoelii CSPmut parasite-infected mosquitoes (n = 45) at the indicated time points after NOX5 knockdown. For box-plot diagram (a): middle line represents median; boxes extend from the 25th to 75th percentiles. The whiskers mark the 10th and 90th percentiles. a, b A two-sided Student’s t-test was used for the statistical analysis. c, d A two-sided Mann–Whitney U test was used for the statistical analysis. The data were presented as the means ± SD; ns, no significance; p-values were shown. The data were combined based on three independent experiments (a–d). Source data are provided as a Source Data file.

