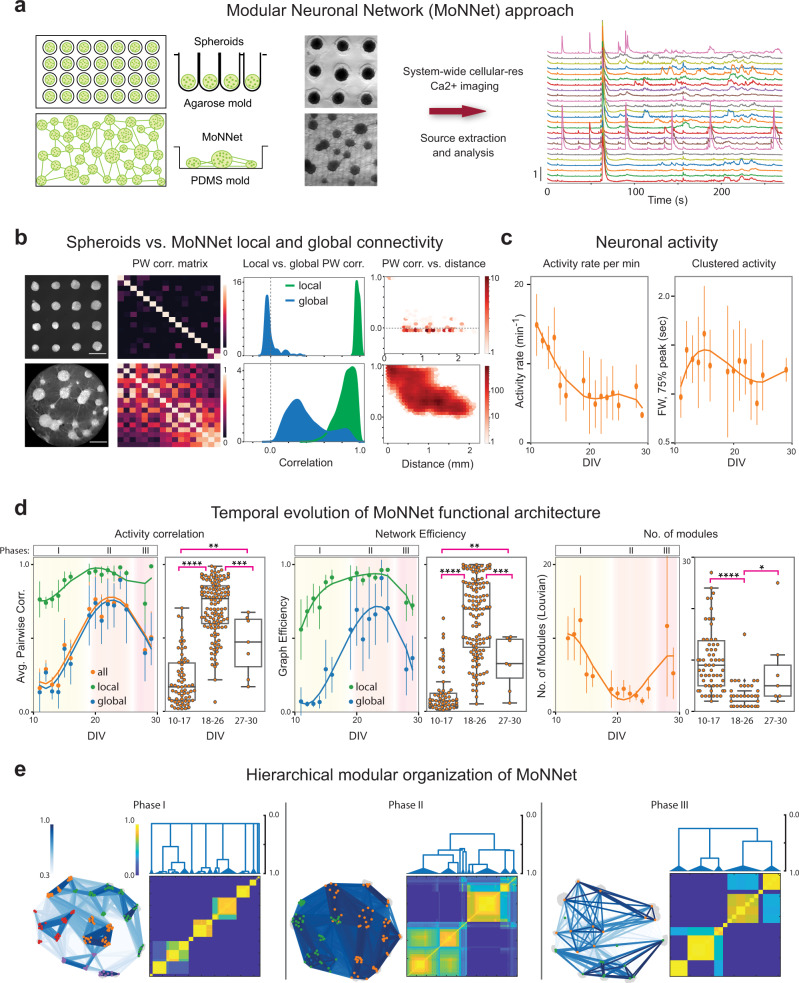
Fig. 1. Characterization of Modular Neuronal Network (MoNNet) approach.
a Schematic overview of MoNNet approach. Extracted embryonic hippocampal cells were infected with AAV1.Syn.GCaMP6f.WPRE.SV40, and plated on a PDMS mold for self-organized assembly of MoNNet, or on an agarose mold to generate spheroids. System-wide cellular-resolution Ca2+ imaging was performed at 30 Hz. b Comparison of local (i.e. neuron pairs within same spheroids) and global (i.e. across spheroids) functional connectivity in spheroids vs. MoNNet. Left to right: representative images; pairwise (PW) correlation matrix of aggregated activities of spheroids; neuronal PW correlation histograms; density plot for correlation vs. distance. Also see Supplementary Fig. 1 and Video 1 for representative raster plots and neuronal activity, and Supplementary Fig. 2 for PW correlation vs. distance relationships, and for distribution of spheroids sizes and distances among nearest neighbors in MoNNets. These representative comparisons were independently repeated >10 times. c, d Temporal evolution of MoNNet functional properties assessed by Ca2+ imaging of 282 different MoNNet samples. Note that each sample was only imaged once to minimize image acquisition associated artifacts and non-active samples were filtered. In all graphs, biologically independent samples (n) across DIVs as follows: n(11): 7, n(12): 5, n(13): 9, n(14): 27, n(15): 11, n(16): 7, n(19): 28, n(20): 33, n(21): 14, n(22): 29, n(23): 9, n(24): 10, n(25): 7, n(28): 3, n(29): 4. c Activity rates per minute and Full width at 75% of peak. d Left-to-right: average PW correlation of local (green), global (blue) and all (orange) neuron pairs; distribution of average global PW correlation in three phases; local and global network efficiency of weighted functional graphs; number of detected modules. Statistical significance was calculated by one-way ANOVA with post-hoc Tukey’s test for multiple comparisons (*padj < 0.05, **padj < 0.01, ***padj < 0.001, ****padj < 0.0001). padj (Activity Correlation) for DIV 10–17 & 18–26: 1.8e−43, for 10–17 & 27–30: 0.00098, for 18–26 & 27–30: 0.00052. padj (Network Efficiency) for DIV 10–17 & 18–26: 3.4e−34, for 10–17 & 27–30: 0.0004, for 18–26 & 27–30: 0.0026. padj (No. of Modules) for DIV 10–17 & 18–26: 3.2e−21, for 18–26 & 27–30: 1.6e−8. Also see Supplementary Fig. 2 for comparisons of all the measures across the three phases, Supplementary Videos 2, 3 for example recordings of MoNNets and spheroids from the three phases, and Supplementary Video 4 for older (DIV 49 and 64) MoNNet samples. The error bars are std. deviations and center points are mean values. The boxplots show minimum, first quartile, median and third quartile. e Representative examples of hierarchical modular organization of MoNNets. Left-to-right: MoNNet functional graph with nodes in same modules colored same, and co-classification (into the same module) probability heat maps and their consensus clustering dendrograms. Also see Supplementary Fig. 3 for results from multiple edge weight thresholds. For all plots, error bars are std. deviations and center points are mean. The error bars in histograms are 95% confidence interval. All scale bars are 500 μm. Source data are provided as a Source Data file.

