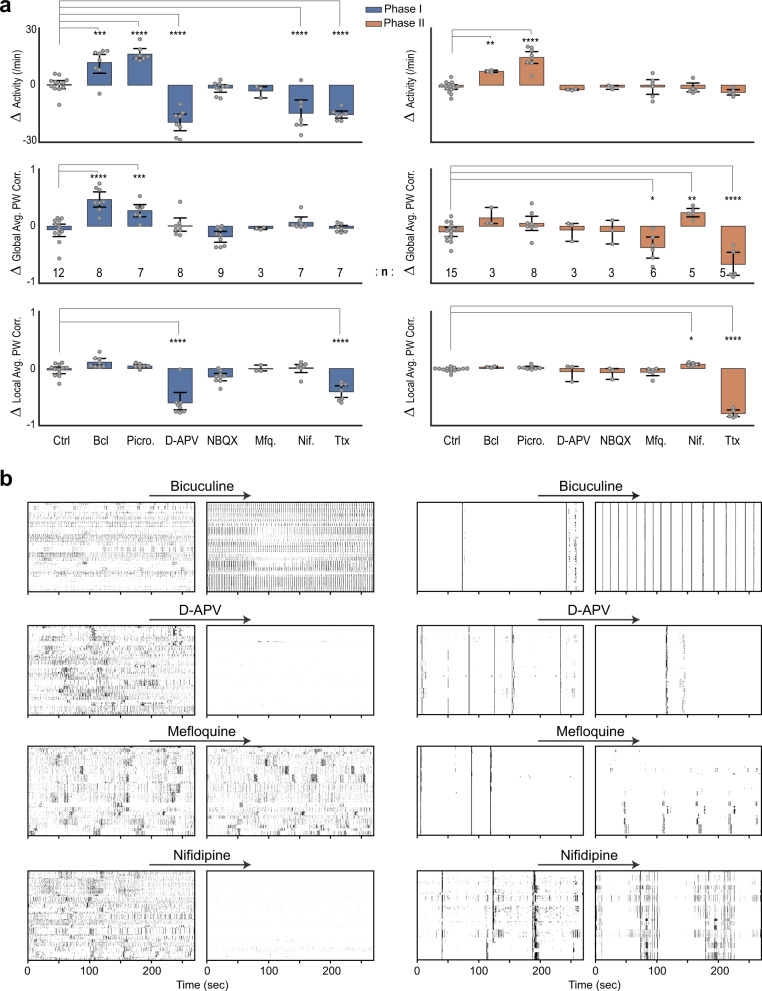
Fig. 2. Pharmacological characterization of MoNNet neuronal and network activity.
a Characterization of MoNNet functional properties by pharmacological treatments with GABAergic and Glutamatergic synaptic inhibitors: Bicuculine [10 μM], Picrotoxin[10 μM], D-APV [40 μM] and NBQX [10 μM]), and ionic channel blockers: Mefloquine [25 μM], Nifedipine [10 μM] and TTX [1 μM]. Control samples were treated with the solvent DMSO alone. Y-axes quantify the increment relative to the baseline in same samples, after 1 h of treatments. Number of biological replicates (n) is shown on the plot. Blue and Orange bars are for MoNNets in phase I and II, respectively. Statistical significance was calculated by using one-way ANOVA and Dunnett multiple comparison test. * padj < 0.05, **padj < 0.01, ***padj < 0.001, ****padj < 0.0001. Bar heights are mean, and the error bars are 95% confidence interval. All sample replicates are biological. b Representative raster plots before (baseline) and after treatments. Left and right columns are for phase I and II, respectively. Also see Supplementary Figs. 4, 5 for complete set of representative raster plots, and Supplementary Videos 5, 6 for representative recordings before and after pharmacological treatments. Source data are provided as a Source Data file.

