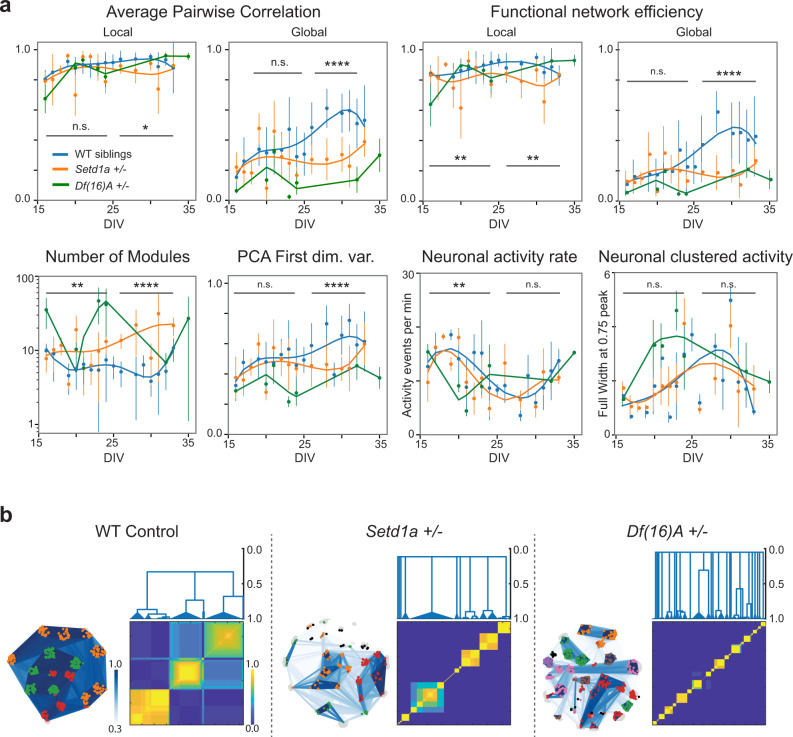
Fig. 5. Characterization of in vitro models of SCZ-associated network pathophysiology.
a Comparison of various local and global quantitative measures of MoNNets derived from Setd1a+/− (orange), WT siblings(blue) and Df(16)A+/− (green): average pairwise correlation, global efficiency of functional weighted graphs, number of detected modules, activity data variance captured by the first PCA dimension, predicted activity-onset events rate per minute; full width at 75% of the maximum peak of ∂F/F traces. Statistical significance was calculated by comparing pooled data (black bars) of Setd1a+/− vs. WT siblings. Statistical significance (two-sided t-test) is defined as: *p < 0.05, **p < 0.01, ***p < 0.001, ****p < 0.0001. For WT control siblings, 272 different MoNNet samples were imaged. Note that each sample was only imaged once to minimize image acquisition associated artefacts and non-active samples were filtered. Biologically independent samples (n) across DIVs in graph as follows. n(16): 12, n(17): 6, n(19): 7, n(20): 8, n(21): 14, n(22): 13, n(23): 12, n(24): 14, n(25): 6, n(26): 7, n(28): 7, n(29): 8, n(30): 6, n(31): 9, n(32): 9, n(33): 5. For Setd1a+/− 158 different MoNNet samples were imaged. Each sample was only imaged once, and non-active samples were filtered. Biologically independent samples (n) across DIVs in graph as follows. n(16): 12, n(17): 5, n(18): 3, n(19): 6, n(20): 8, n(21): 6, n(22): 14, n(23): 12, n(24): 5, n(26): 5, n(28): 5, n(30): 7, n(31): 7, n(33): 3. For Df(16)A+/−, 58 different samples were imaged. Each individual sample was imaged only once and non-active samples were filtered. Biologically independent samples (n) across DIVs in graph as follows. n(16): 4, n(20): 3, n(21): 9, n(23): 4, n(24): 8, n(32): 8, n(35): 4. b Representative examples of comparing hierarchical modular organization. Nodes belonging to same module are colored same. Co-classification matrix heatmap and clustering dendograms are shown to visualize hierarchical relationship. For all plots, mean and std. deviation are plotted. Also see Supplementary Fig. 11 and Video 8. Source data are provided as a Source Data file.

