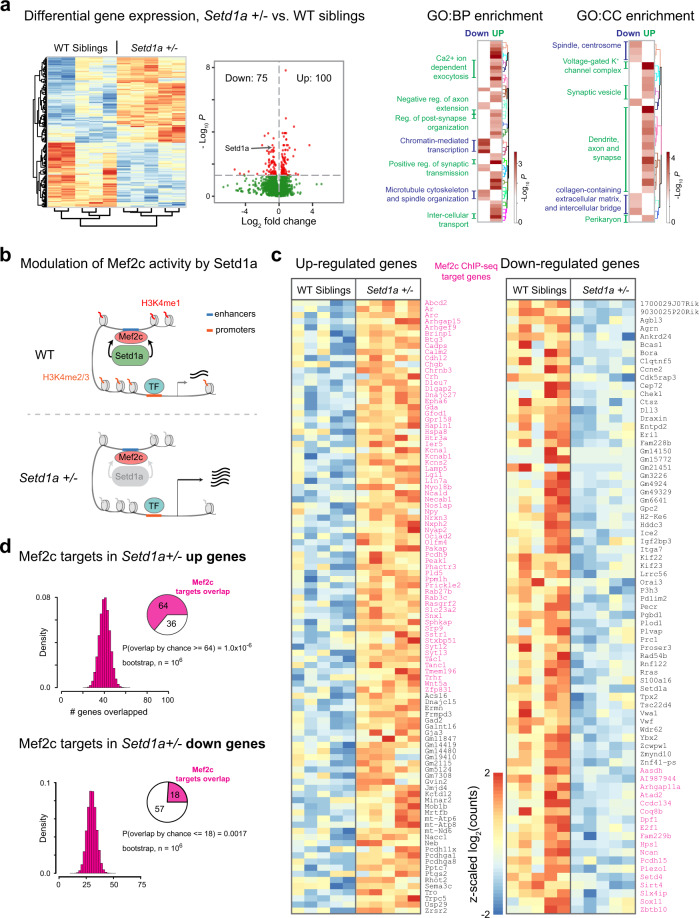
Fig. 6. Characterization of gene expression differences in Setd1a+/− and WT siblings.
a Heat map and volcano plot of differential gene expression (DESeq2, padj < 0.05) in Setd1a+/− relative to the WT siblings (DIV 30). Comparative enrichment of Gene Ontology: Biological Process (GO:BP) and Cellular Components (GO:CC) terms is shown for up (green) and down (blue) regulated genes. Also see Supplementary Fig. 12 for complete list. b Schematics summarizing the modulation of Mef2c activity by Setd1a. c Gene expression heat maps are shown for up- and down- regulated genes. Magenta-colored genes are also known targets from Mef2c ChIP-seq studies. d Bootstrap sampling (106) for estimating statistical significance of overlap with Mef2c targets by chance. P-values are uncorrected probabilities as defined in the panel. All sample replicates are biological.

