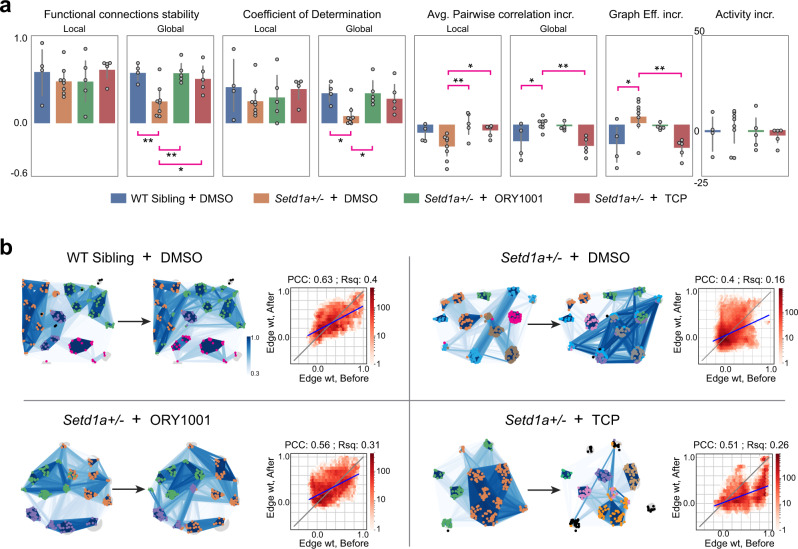
Fig. 7. Partial rescue of Setd1a+/− MoNNet network pathophysiology by pharmacological inhibition of LSD1 demethylase activity.
a Barplots comparing various quantitative measures of network function of WT sibling MoNNets (blue) and Setd1a+/− MoNNets treated with DMSO(orange), ORY-1001(green) and TCP(red). All treatments were for two days. From left to right: local and global functional connections stability as measured by the correlation in edge weights of functional graph before and after the treatment; local and global coefficient of determination (r-square fit edge weights before and after treatment) quantifying the predictability of the after-treatment state; average pairwise correlation increment as measured by increase in correlation of same pair before and after, averaged over an entire MoNNet; global graph efficiency increment measures of functional graphs; activity rate per minute. Statistical significance were calculated by using one-way ANOVA and Dunnett multiple comparison test with WT sibling or Setd1a + /− group as controls (***padj < 0.001; **padj < 0.01; *padj < 0.05). Error bars represent 95% confidence interval and center are means. All samples are biological replicates. b, Representative examples of WT sibling MoNNets and Setd1a+/− MoNNets treated with DMSO, ORY-1001, and TCP. Nodes belonging to same modules are colored same. Co-classification matrix heatmap and clustering dendrograms are shown to visualize the hierarchical relationship in modules activity. The density scatter plot compares edge weight before and after treatment. PCC: Pearson’s correlation coefficient of the scatter plot; Rsq: r-square measure of fitness of linear regression fit with a straight line. Source data are provided as a Source Data file.

