
FIGURE 1.
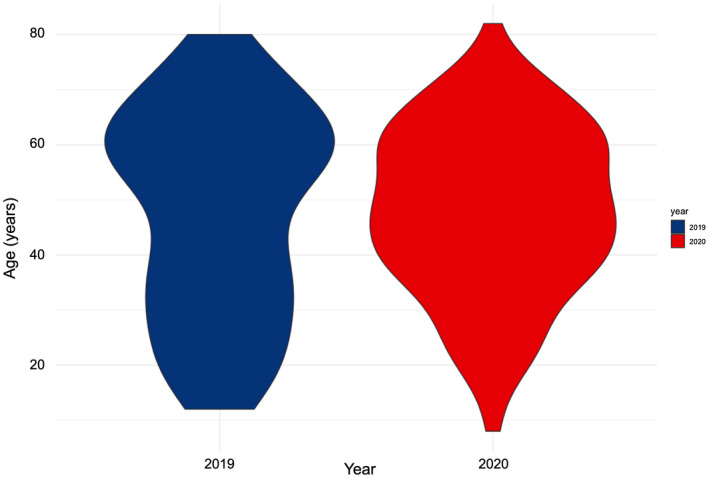
Distribution of age by year: Density plot of age in 2019 (blue) and 2020 (red)
Official websites use .gov
A
.gov website belongs to an official
government organization in the United States.
Secure .gov websites use HTTPS
A lock (
) or https:// means you've safely
connected to the .gov website. Share sensitive
information only on official, secure websites.
Distribution of age by year: Density plot of age in 2019 (blue) and 2020 (red)