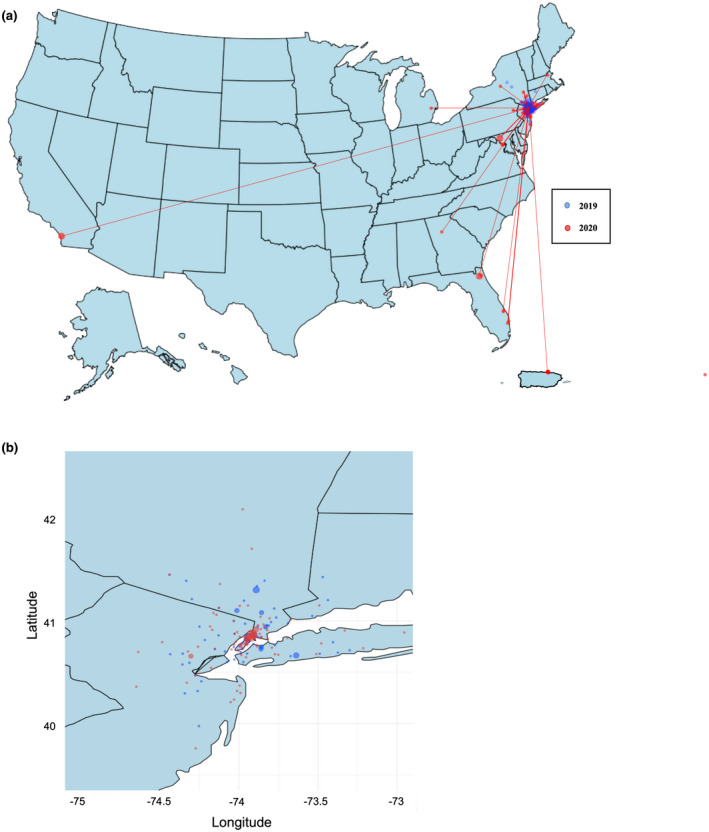
FIGURE 3.

Geographic distribution of genetic counseling visits by year. (a) U.S. Map: Zip codes of patients seen for genetic counseling in 2019 (blue) and 2020 (red) plotted by latitude and longitude. (b) New York and surrounding states: Zip codes of patients seen for genetic counseling within the tri‐state area (longitude −75 to −73 and latitude 40–42) in 2019 (blue) and 2020 (red)
