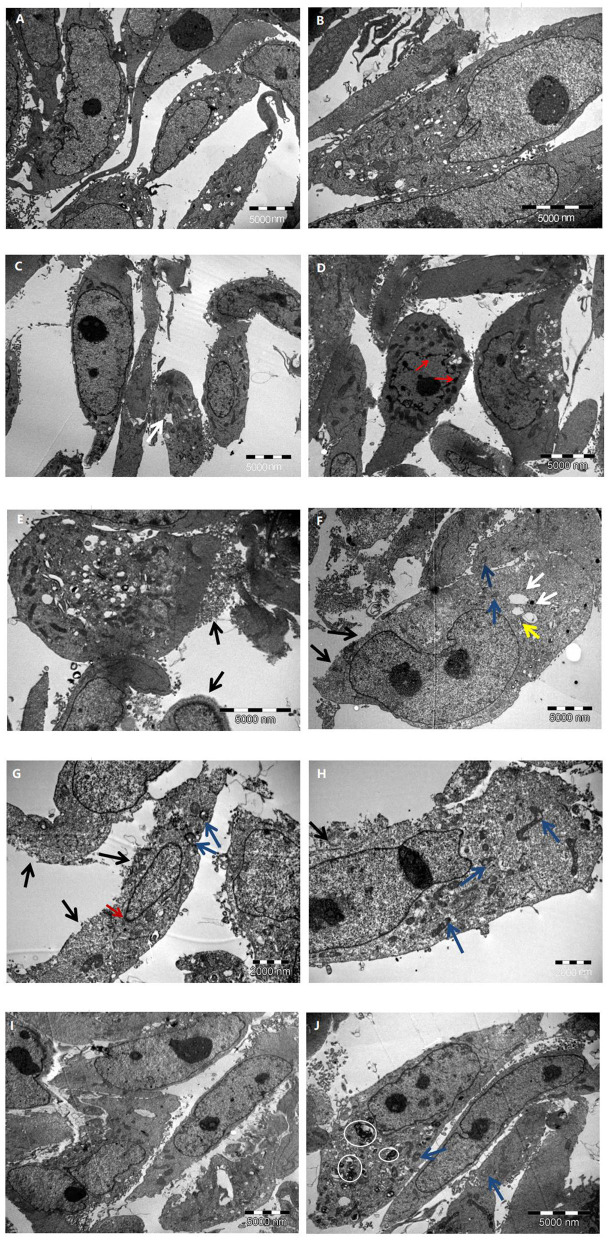
Figure 4.
The characteristic of HK-2 cells at different glucose concentrations. (A,B) Control group; (C–E) 15 mmol/L glucose group; (F–H) 30 mmol/L glucose group; (I,J) 45 mmol/L glucose group. Black arrow: cell membrane injure; White arrow: endoplasmic reticulum vesiculated expansion; Blue arrow: mitochondrial vacuolation; Yellow arrow: Golgi swelling; Red arrow: chromatin marginated; White circle: myeloid structure.

