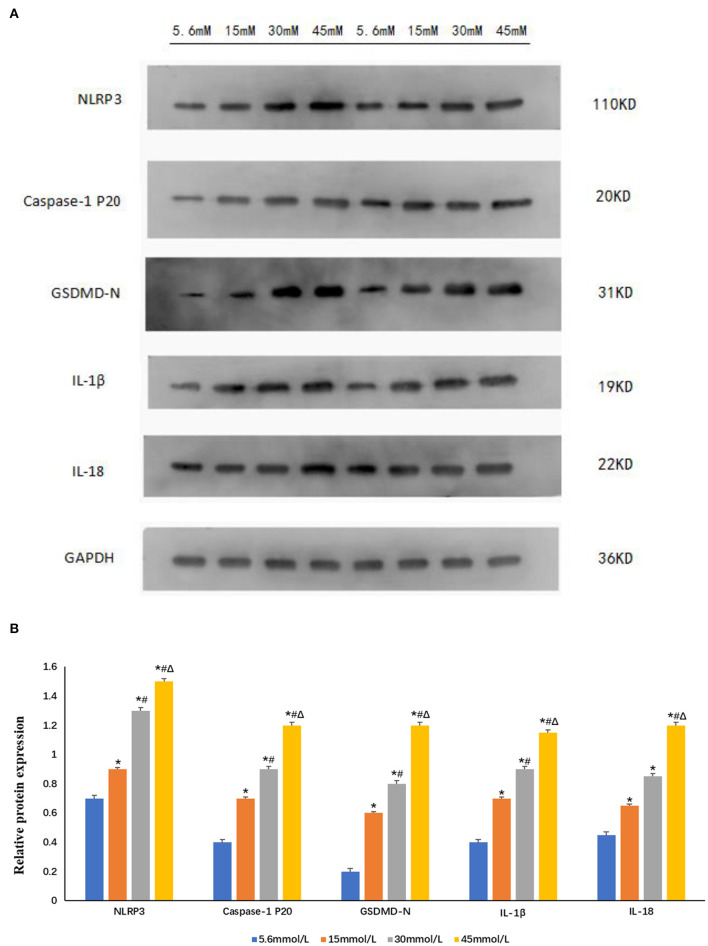
Figure 5.
Expression of NLRP3 and pyroptosis-related proteins increased after stimulation with different glucose concentrations in HK-2 cells. (A) Western blot showing the expression of NLRP3, caspase-1 p20, GSDMD-N, IL-1β, and IL-18 increased in a glucose-concentration-dependent manner. (B) The protein fold change of NLRP3, caspase-1 p20, GSDMD-N, IL-1β, and IL-18, using Gapdh as a reference gene. Data is presented as the average fold change compared to controls ± s.e.m. n = 3. *P < 0.05 vs. 5.6 mmol/L glucose group; #P < 0.05 vs. 15 mmol/L glucose group; ΔP < 0.05 vs. 30 mmol/L glucose group. n = 3.

