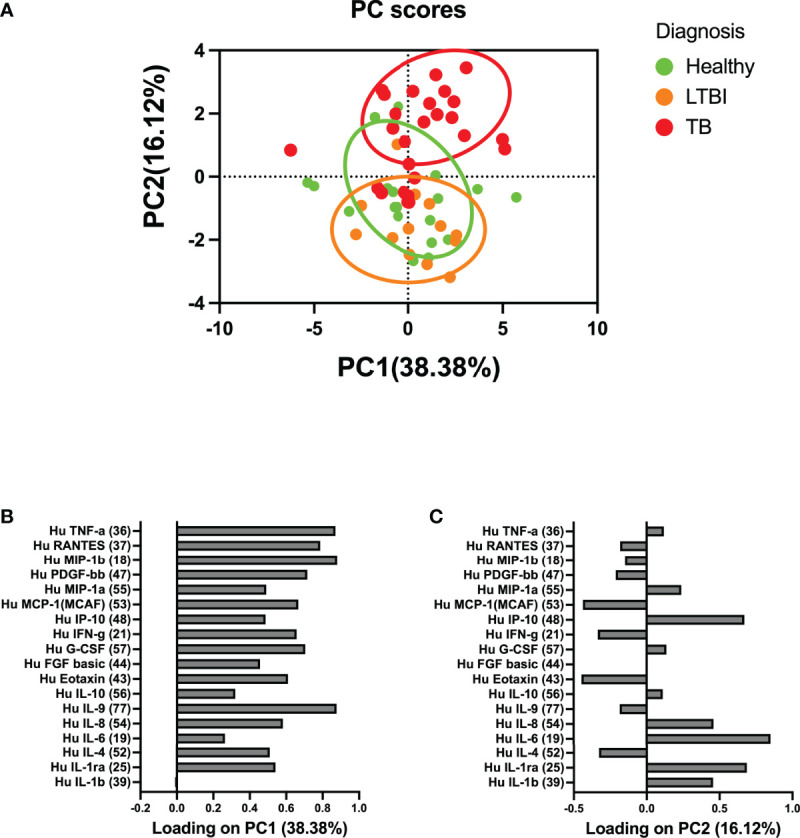
Figure 1.

Principal component analysis (PCA) of the association between circulatory cytokines and TB disease states. (A) Circulatory cytokines separate according to whether individuals are healthy, latent TB infected, or with active TB disease. (B) PC1 accounted for 38.38% of the variance observed in the data set. (C) PC2 accounted for 16.12% of the variance observed in the data set. PC2 was used to define the association between circulatory cytokine and whether individuals were healthy, LTBI, or those who had active TB. Each dot represents a participant score on the loading components.
