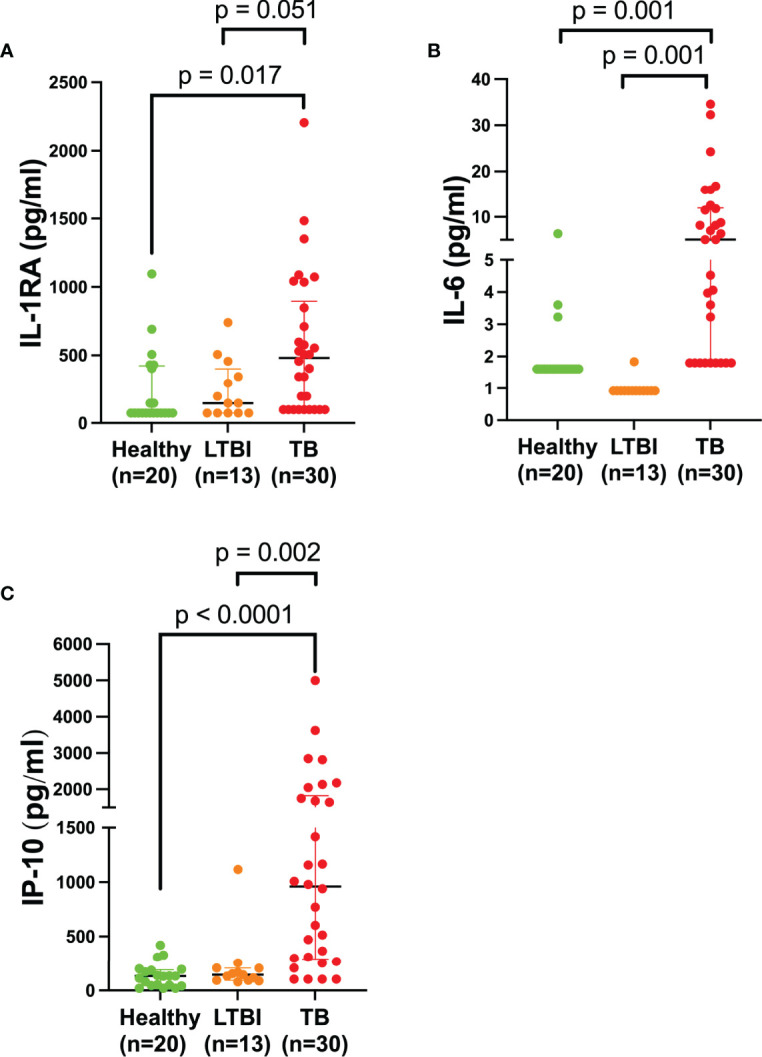
Figure 2.

Plasma IL-RA, IL-6, and IP-10 are elevated in TB patients. Quantification of various cytokines in the plasma of healthy (n=20) individuals compared to LTBI (n=13) and TB (n=30) patients. Each dot represents a participant sample. (A) IL-1RA, (B) IL-6, and (C) IP-10 were quantified and measured in pg/ml. Significant differences were identified as those values that were less than p<0.05. Data was analyzed using the one-way ANOVA and followed by a multiple comparisons test using Tukey’s test. Tukey’s p-values have been reported in the above figure and illustrate the differences observed between groups.
