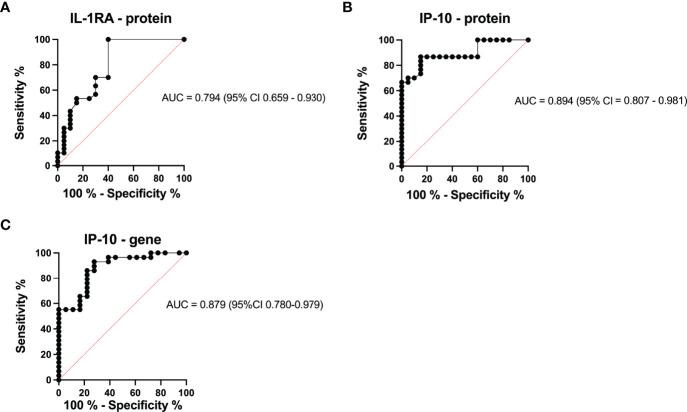
Figure 4.
ROC curve characteristics for IP-10 protein and IL-1RA protein as well as IP-10 mRNA, as discriminatory markers for TB. AUC, specificity, sensitivity, PPV, and NPV indicate the power of (A) IL-1RA protein abundance, (B) IP-10 protein abundance, and (C) IP-10 mRNA expression which are reported and indicate the power of these biomarkers for discriminating between those who are healthy and those with TB.

