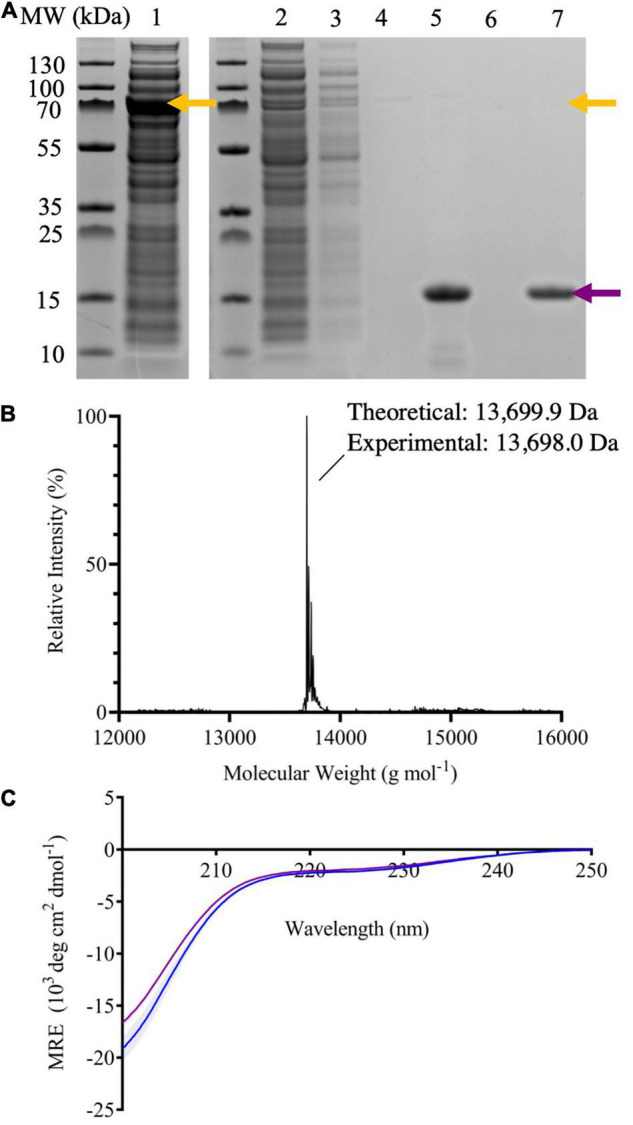
FIGURE 2.

(A) SDS-PAGE of samples taken throughout the purification process of 7–140 α-syn; crude extract (lane 1), flow through after passing the crude extract through the column five times (lane 2), flow through after washing the column with column buffer (lane 3), flow through after equilibrating the column with cleavage buffer (lane 4), compiled fractions containing the target protein after dialysis (lane 5), flow through after stripping the column with NaOH (lane 6), and the target protein purified by SEC (lane 7). The yellow arrows indicate the molecular weight (MW) of the fusion protein, while the purple arrow the one of 7–140 α-syn. (B) The deconvoluted ESI-MS spectrum of 7–140 α-syn. Theoretical mass 13,699.9 Da, experimental mass 13,698.0 Da. (C) The CD spectra of monomeric WT α-syn (blue) and 7–140 α-syn (purple). n = 3, error bars representing the standard deviation are shown as transparent bars.
