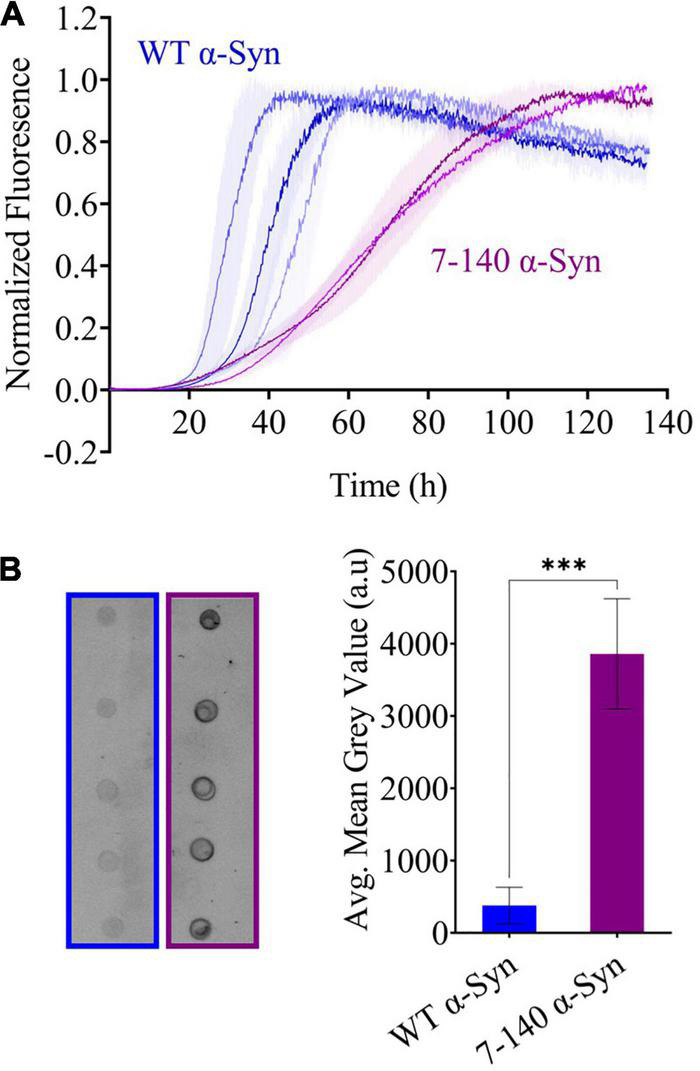
FIGURE 3.

(A) Beaded aggregations of WT (blue) and 7–140 (purple) α-syn. WT and 7–140 α-syn have t1/2 values of 38 ± 7 and 69.7 ± 0.7 h and tlag values of 28 ± 6 and 31 ± 6 h, respectively. Each data set is the average of the normalized technical replicates (n ≥ 3, error bars are the standard deviation of the mean). Three independent replicates for WT α-syn and two independent replicates for 7–140 α-syn are shown. (B) Dot blots (left) and quantifications (right) of the soluble fractions after aggregation of WT (blue) and 7–140 (purple) α-syn after aggregation (n = 5, values represent means and error bars are the standard deviation, Welch’s t-test ***p = 0.0002).
