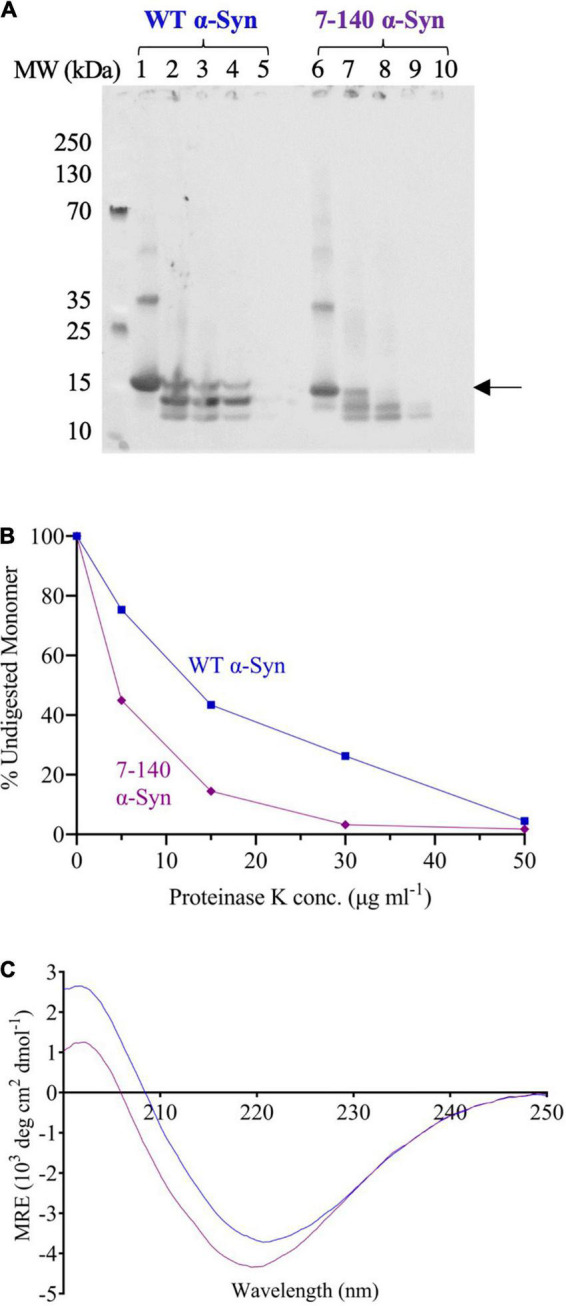
FIGURE 5.

(A) Proteinase K digestion of WT (lanes 1–5) and 7–140 (lanes 6–10) α-syn fibrils incubated with 0, 5, 15, 30, and 50 μg/ml proteinase K, respectively. The arrow indicates the band that has been quantified and plotted. A representative experiment is shown. (B) The percentage of undigested monomeric WT (blue) and 7–140 (purple) α-syn at various protease concentrations. (C) CD spectra of WT (blue) and 7–140 (purple) α-syn fibrils. A representative spectrum for each variant is shown.
