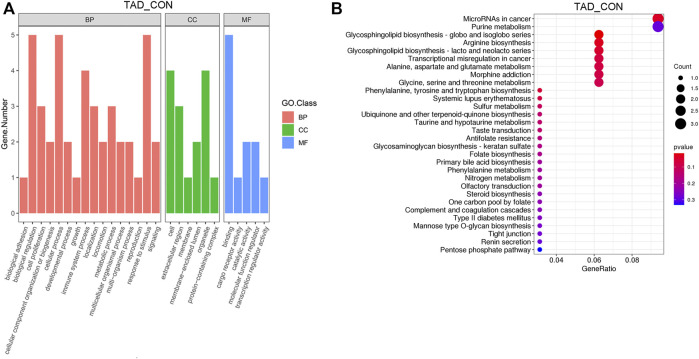
FIGURE 3.
Functional enrichment analysis of DEGs. (A) Functional enrichment clustering analysis of DEGs was performed by top GO terms in biological process, cellular component, and molecular function. (B) Bubble chart of the KEGG pathways (top 30) that DEGs significantly involved in. The rich factor is defined as the ratio of the number of DEGs to the total number of genes enriched in a specific category. The count of DEGs was roughly represented by the size of circles. Log10-adjusted p-value was indicated by the color saturation from green to red. GO, Gene Ontology; BP, biological processes; CC, cellular components; MF, molecular functions; KEGG, Kyoto Encyclopedia of Genes and Genomes; DEGs, differentially expressed genes. p-value < 0.05.

