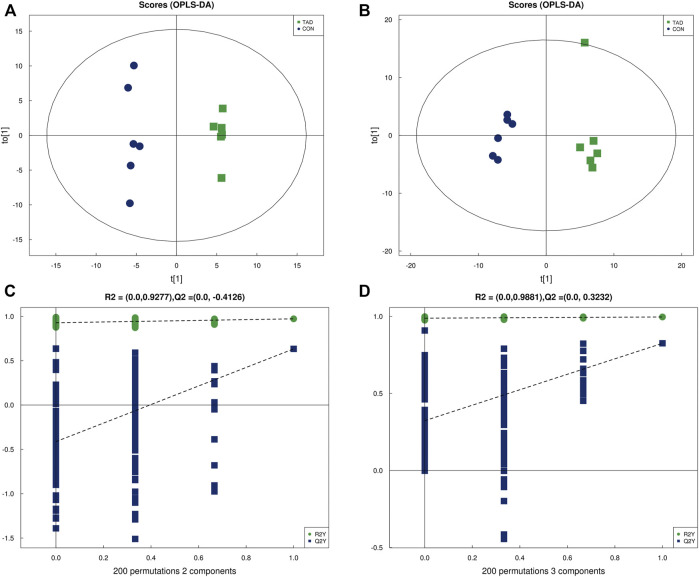
FIGURE 4.
OPLS-DA analysis of alterations in the metabolite profile. (A) OPLS-DA score plot derived from metabolite ions acquired using the ESI+. (B) OPLS-DA score plot derived from metabolite ions acquired using the ESI-. (C,D) Permutation test for OPLS-DA in positive and negative ion mode. OPLS-DA, orthogonal partial least-squares discriminant analysis; ESI+, electrospray ionization positive ion mode; ESI-, electrospray ionization negative ion mode.

