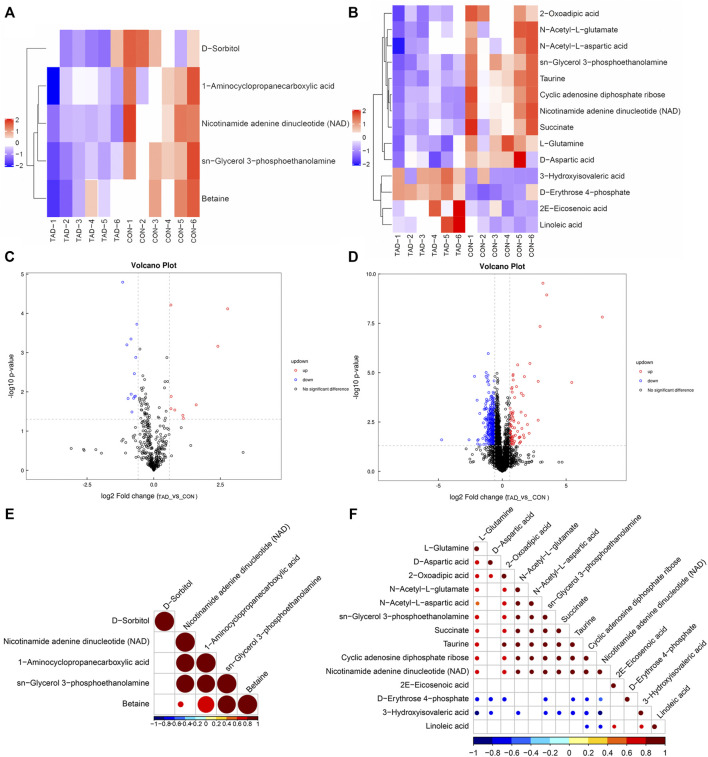
FIGURE 5.
Metabolic differences between colorectal cancer HCT116 cells treated with tadalafil groups (TAD) and without groups (CON). (A,B) Cluster heatmap of DAMs in ESI+ and ESI-. The value of DAMs expression after scale number was indicated by the blue to red color scale. (C,D) Volcano plots of DAMs in ESI+ and ESI−. Red indicates upregulated accumulated metabolites (p-value <0.05, FC > 1.5), and blue indicates downregulated accumulated metabolites (p-value <0.05, FC < 0.67). Black indicates no significant difference of metabolites. (E,F) Pearson correlation analysis of the DAMs based on p < 0.05 and VIP >1 in ESI+ and ESI−. The value of the Pearson correlation coefficient was represented by the color label. ESI+, electrospray ionization positive ion mode; ESI−, electrospray ionization negative ion mode; DAM, differentially accumulated metabolites.

