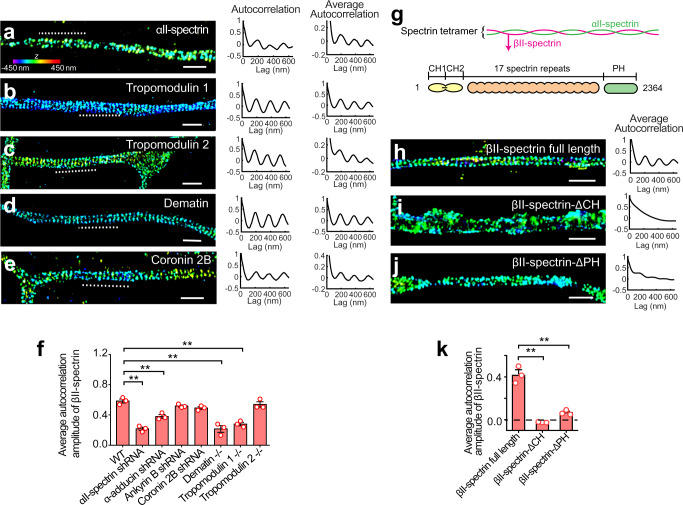
Fig. 2. Super-resolution imaging of actin-binding MPS components.
a–e Left: 3D STORM images of αII-spectrin (a), tropomodulin 1 (b), tropomodulin 2 (c), dematin (d), and coronin 2B (e) in axonal regions of cultured hippocampal neurons. Middle: One-dimensional (1D) autocorrelation of the imaged molecules for the axon region indicated by the dashed line in the left panels. Signals were projected to the longitudinal axis of the axon segment, and 1D autocorrelation was calculated using the projected signals. Right: Average 1D autocorrelation of the imaged molecules over 20–80 randomly selected axon regions. Scale bars: 1 μm. Colored scale bar indicates the z-coordinates. f Average 1D autocorrelation amplitudes of the βII-spectrin distribution, indicating the degree of periodicity of the MPS, of untreated neurons, neurons transfected with adenoviruses expressing αII-spectrin shRNA, α-adducin shRNA, ankyrin B shRNA, or coronin 2B shRNA, and neurons cultured from tropomodulin 1, tropomodulin 2 or dematin knockout mice. Data are mean ± s.e.m. (n = 3 biological replicates for each condition; 40–80 axonal regions were examined for each condition). **p < 0.005 (two-sided unpaired Student’s t-test); p-values (from left to right): 6.0 × 10⁻⁴, 4.9 × 10⁻³, 4.0 × 10⁻³ and 1.1 × 10⁻³. g Domain organization of βII-spectrin. h–j Left: 3D STORM image of axon regions of βII-spectrin knockout neurons transfected with plasmid expressing GFP-tagged full length βII-spectrin (h), βII-spectrin-ΔCH mutant (i) or βII-spectrin-ΔPH mutant (j). The proteins were visualized by immunostaining with anti-GFP antibody. Scale bars: 1 µm. Right: average 1D autocorrelation of the imaged proteins. k Average 1D auto-correlation amplitudes for the distributions of GFP-tagged full length βII-spectrin and two GFP-tagged βII-spectrin truncation mutants, as described in (h–j), calculated from GFP-positive axon segments. Data are mean ± s.e.m. (n = 3 biological replicates for each condition; 30–70 axonal regions were examined for each condition). **p < 0.005 (two-sided unpaired Student’s t-test); p-values (from left to right): 1.3 × 10⁻³ and 1.4 × 10⁻⁴. STORM images in a–e and h–j are representative examples from three independent experiments with similar results. Source data are provided in the Source Data file.

