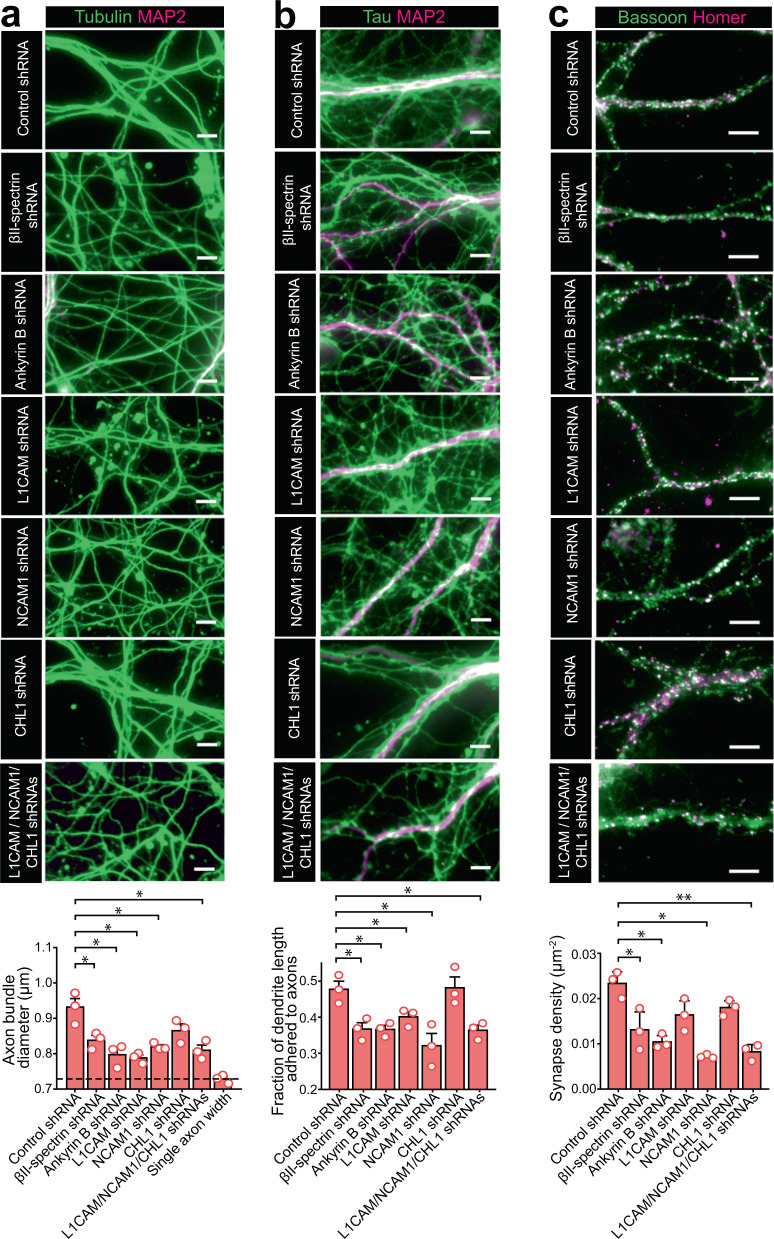
Fig. 5. The MPS plays a role in axon-axon interactions, axon-dendrite interactions and synapse formation.
a Top panels: Conventional fluorescence images of tubulin (green) and dendrite marker MAP2 (magenta) for neurons transfected with adenoviruses expressing scrambled (control) shRNA, βII-spectrin shRNA, ankyrin B shRNA, L1CAM shRNA, NCAM1 shRNA, CHL1 shRNA, or shRNAs against all three adhesion molecules (L1CAM, NCAM1 and CHL1). The tubulin-positive neurites lacking MAP2 signal are axons. Bottom panel: Average diameter of axon bundles (or single axons) quantified for the conditions described in the top panels. The last bar and dashed line represent the average single-axon diameter obtained from images of sparsely cultured neurons. * indicates p < 0.05 (two-sided unpaired student’s t-test); p-values (from left to right): 3.9 × 10⁻², 1.3 × 10⁻², 1.7 × 10⁻², 3.7 × 10⁻², 1.8 × 10⁻² and 9.3 × 10⁻³. b Top: Conventional fluorescence images of cultured neurons immunostained for axon marker Tau (green) and dendrite marker MAP2 (magenta) under the conditions described in (a). Bottom: Average fraction of the total length of dendrites that are bundled with axons, quantified for the conditions indicated in the top panel. *p < 0.05 (two-sided unpaired student’s t-test); p-values (from left to right): 1.7 × 10⁻², 1.8 × 10⁻², 4.9 × 10⁻², 2.4 × 10⁻² and 1.5 × 10⁻². c Top: Conventional fluorescence images of cultured neurons immunostained for the presynaptic marker Bassoon (green) and postsynaptic marker Homer1 (magenta) under the conditions described in (a). Bottom: Average synapse density per unit area on dendrites, quantified for the conditions as described in the top panel. Only puncta showing both presynaptic and postsynaptic marker signals were counted as synapses. *p < 0.05 and **p < 0.005 (two-sided unpaired student’s t-test);p-values (from left to right): 3.8 × 10⁻², 6.4 × 10⁻³, 9.6 × 10⁻³ and 3.3 × 10⁻³. Scale bars: 5 μm. Data are mean ± s.e.m (n = 3 biological replicates; 15–25 imaged regions per condition). Images in a–c are representative examples from three independent experiments with similar results. Source data are provided in the Source Data file.

