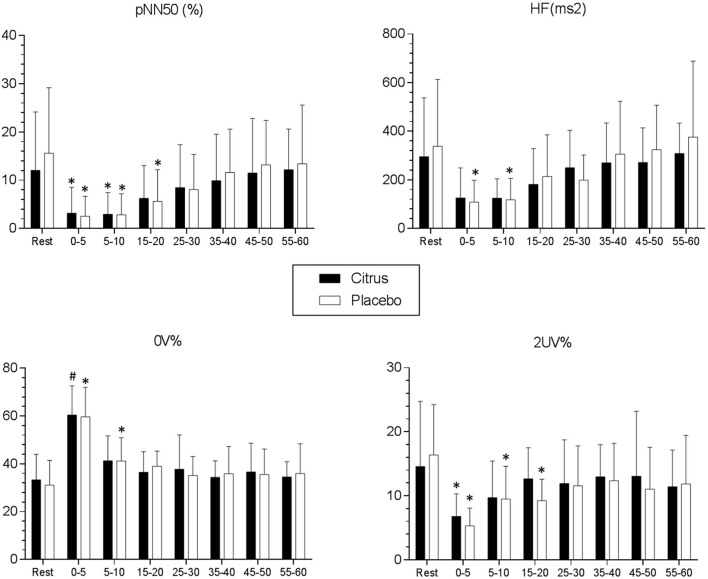
Figure 3.
Mean values and respective standard deviations of pNN50 (%), HF (ms2), 0V% and 2UV% obtained at rest and during recovery from submaximal aerobic exercise. *Values with significant differences in relation to rest (p < 0.05) (Friedman, Dunn's post-test); #Values with significant differences in relation to rest (p < 0.05) (ANOVA1, Bonferroni's post-test); pNN50 (%): percentage of adjacent R-R intervals with a difference of duration >50 ms; HF (ms2): High frequency spectrum (0.15–0.40 Hz); 0V%: zero variations; 2 UV%: two unlike variations.

