Figure 2.
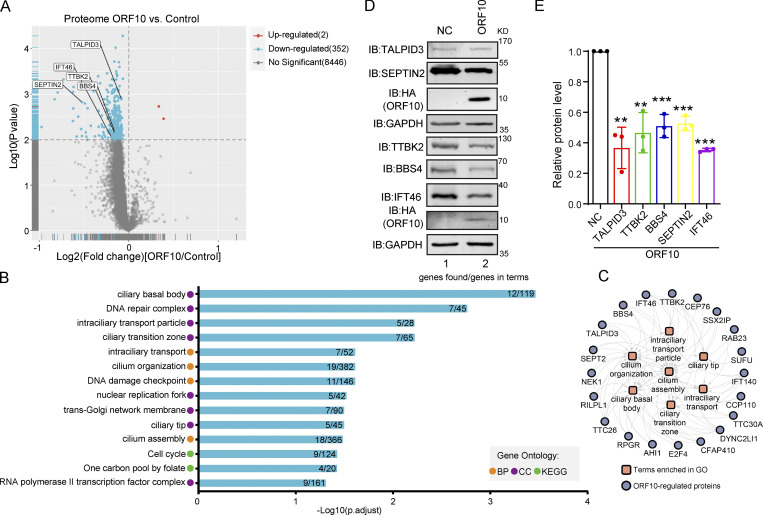
ORF10 downregulates cilium-related proteins. (A) Volcano plots of differentially expressed proteins (DEPs) were detected in a quantitative proteomic analysis of ORF10-expressing and empty vector control HEK293T cells. The red spots and blue spots indicate significantly upregulated and downregulated proteins, respectively. (B) Functional classification analysis of DEPs according to enrichment analysis of the biological process (BP) and cellular component (CC) terms and KEGG pathways. (C) The network of DEPs and enriched cilium-related gene ontology terms. (D) Cells expressing ORF10 display reduced accumulation of multiple cilium-related proteins. Immunoblotting analysis of TALPID3, TTBK2, BBS4, SEPTIN2, IFT46, and ORF10 levels in ORF10-expressing and empty vector (NC) control HEK293T cells. GAPDH served as a loading control. (E) Odyssey-based quantification of protein levels in D (n = 3 independent experiments). Data are presented as the mean ± SEM. ** indicated P < 0.01, *** indicated P < 0.001. Statistical analysis was performed with two-tailed unpaired Student’s t test. Source data are available for this figure: SourceData F2.

