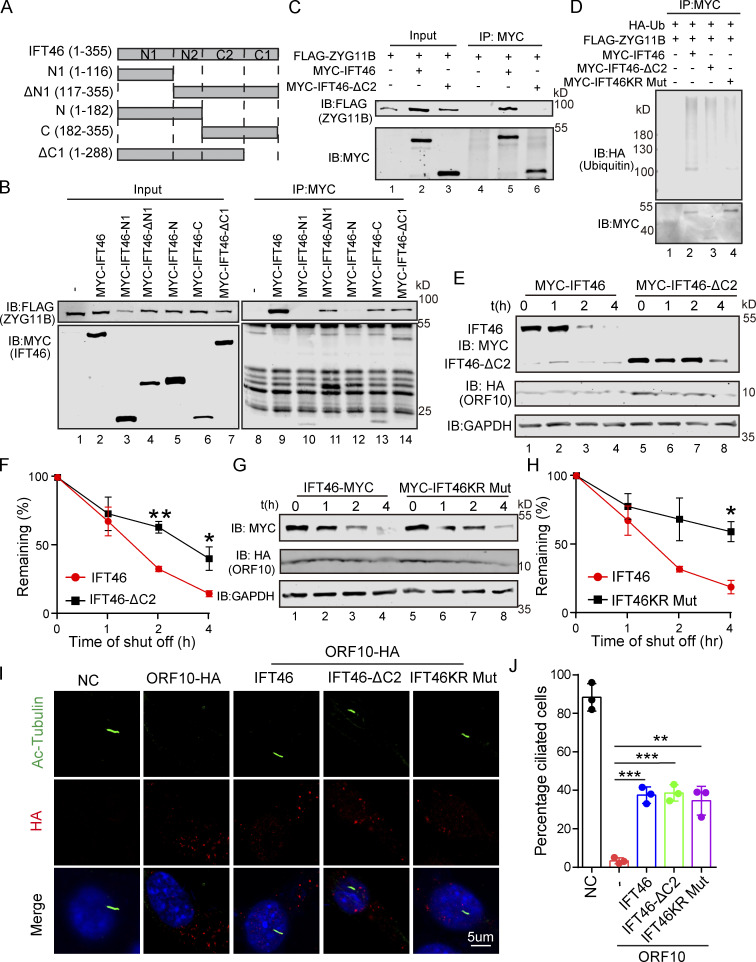
Figure 5.
CUL2ZYG11B promoting IFT46 degradation to impair cilium biogenesis and maintenance via the C2 domain of IFT46. (A) Schematic overview of IFT46 truncation mutants. (B) Interactions between ZYG11B and truncation mutants of IFT46. Immunoprecipitation (IP) of FLAG-tagged ZYG11B and MYC-tagged truncation mutants of IFT46 followed by immunoblotting to detect the interaction in HEK293T cells. (C) C2 domain (amino acids 182–288, IFT46-C2) of IFT46 was sufficient for binding to ZYG11B. MYC-IFT46 (or IFT46-△C2, empty vector) and ZYG11B-FLAG were co-transfected into HEK293T cells. 24 h after transfection, cells were collected for immunoprecipitation (IP) with an anti-MYC antibody, followed by analysis using anti-FLAG and anti-MYC antibodies. (D) CUL2ZYG11B promotes the ubiquitination of IFT46 via the C2 domain of IFT46. HA-Ub, ZYG11B-FLAG, and MYC-IFT46 or IFT46-△C2 were transfected into HEK293T cells. 24 h after transfection, cells were collected for immunoprecipitation (IP) with an anti-MYC antibody, followed by analysis using anti-HA and anti-MYC antibodies. (E) ORF10 promotes the degradation of IFT46 via the C2 domain of IFT46. A cycloheximide chase (CHX) assay of IFT46 or IFT46-△C2 was performed in ORF10-expressing HEK293T cells. Samples were taken at 0, 1, 2, and 4 h after the addition of CHX. The IFT46, IFT46-△C2 and ORF10 protein levels were detected by immunoblotting using MYC and HA antibodies. GAPDH served as a loading control. (F) Quantification of the IFT46 and IFT46-△C2 levels in E. The protein level of IFT46 and IFT46-△C2 was quantified using Odyssey software. (n = 3 independent experiments). Data are presented as the mean ± SEM. ** indicates P < 0.01, * indicates P < 0.05. Statistical analysis was performed with two-tailed unpaired Student’s t test. (G) IFT46 KR Mut blocked the degradation of IFT46. A cycloheximide chase (CHX) assay of IFT46 or IFT46 KR Mut was performed in ORF10-expressing HEK293T cells. Samples were taken at 0, 1, 2, and 4 h after the addition of CHX. The IFT46, IFT46 KR Mut and ORF10 protein levels were detected by immunoblotting using MYC and HA antibody. GAPDH served as a loading control. (H) Quantification of the IFT46 and IFT46 KR Mut levels in G. The protein level of IFT46 and IFT46 KR Mut was quantified using Odyssey software. (n = 3 independent experiments). Data are presented as the mean ± SEM. * indicates P < 0.05. Statistical analysis was performed with two-tailed unpaired Student’s t test. (I) IFT46-△C2 and IFT46 KR Mut overexpression partially rescues the cilia biogenesis defects of ORF10-expressing NIH3T3 cells. Immunofluorescence analysis for Ac-Tubulin (green) and HA (red) in ORF10-expressing, ORF10/IFT46, ORF10/IFT46△C2, ORF10/IFT46 KR Mut co-transfected, and empty-vector cells. Nuclei were stained with DAPI (blue). (J) Quantification of ciliated cells in I (n = 3 independent experiments). Data are presented as the mean ± SEM. ** indicates P < 0.01, *** indicates P < 0.001. Statistical analysis was performed with two-tailed unpaired Student’s t test. Source data are available for this figure: SourceData F5.

