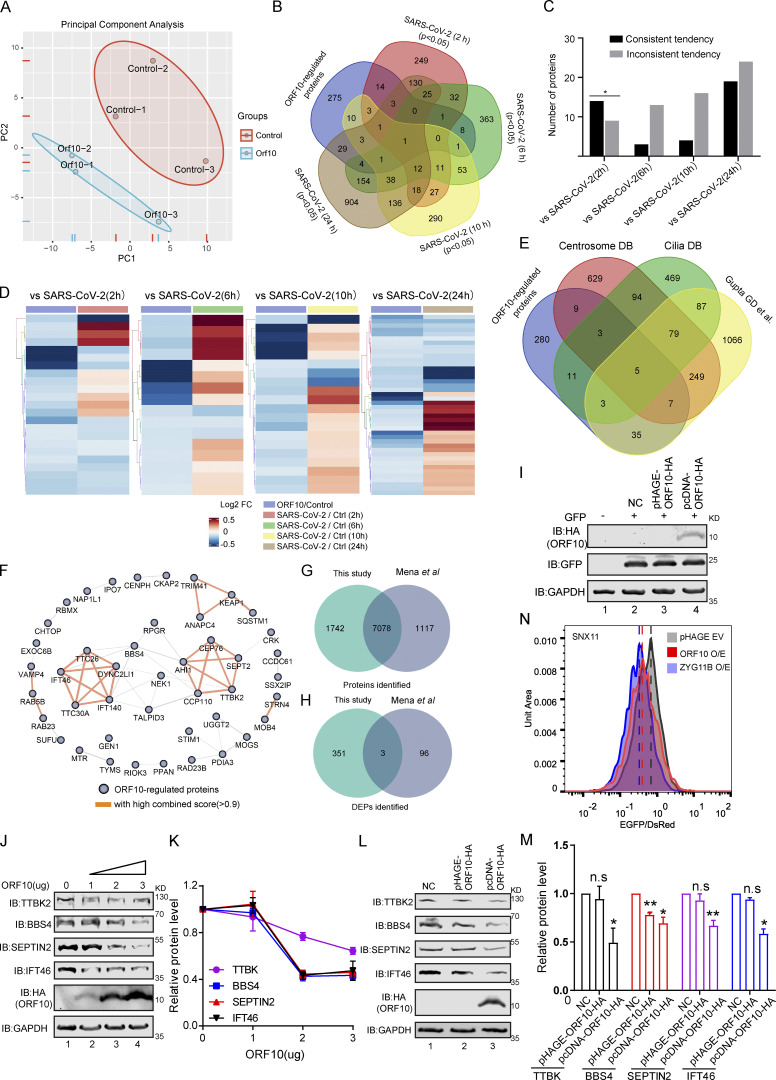
Figure S2.
Overlap of different expression proteins (DEPs) in ORF10 expressed and SARS-CoV-2 infected cells. (A) Principal component analysis (PCA) of proteome of control and ORF10 expression group. (B) Overlap between the DEPs in ORF10 expressed cells and previously identified SARS-CoV-2 infected proteome (Bojkova et al., 2020). (C) Number of proteins in both DEPs of ORF10 expressed cells and SARS-CoV-2 infected proteome. (D) A heatmap of downregulated proteins in ORF10 expressed cells and previously reported SARS-CoV-2 infected cells (Bojkova et al., 2020). (E) Overlap between the DEPs in ORF10 expressed cells and a published cilia-related proteome (Alves-Cruzeiro et al., 2014; Gupta et al., 2015; van Dam et al., 2013). (F) The network of protein–protein interactions between ORF10-regulated cilium proteins according to the String database (Szklarczyk et al., 2017). (G) Overlap between the identified protein in this study and Mena et al. (2021) study. (H) Overlap between the DEPs in this study and Mena et al. (2021) study. (I) Immunoblotting analysis of the expression of pcDNA-ORF10-HA and pHAGE-ORF10-HA plasmids in transfected HEK293T cells within 24 h. (J) The protein level of TTBK2, BBS4, SEPTIN2, and IFT46 was dramatically decreased along with the gradient increased ORF10 expression. Immunoblotting analysis of TTBK2, BBS4, SEPTIN2, IFT46, and ORF10 levels in ORF10-expressing and empty vector (NC) control HEK293T cells. GAPDH served as a loading control. (K) Odyssey-based quantification of protein levels in J (n = 3 independent experiments). Data are presented as the mean ± SEM. Statistical analysis was performed with two-tailed unpaired Student’s t test. (L) Cells transfected with pcDNA-ORF10-HA display reduced level of multiple cilium-related proteins. Immunoblotting analysis of TTBK2, BBS4, SEPTIN2, IFT46, and ORF10 levels in ORF10-expressing and empty vector (NC) control HEK293T cells. GAPDH served as a loading control. (M) Odyssey-based quantification of protein levels in L (n = 3 independent experiments). Data are presented as the mean ± SEM. * indicates P < 0.05, ** indicates P < 0.01. Statistical analysis was performed with two-tailed unpaired Student’s t test. (N) Stability analysis of the SNX11 degron-fused EGFP with exogenous expression of ORF10 and ZYG11B proteins. overexpression of ZYG11B substantially reduced the EGFP/DsRed ratio by accelerated degradation of the SNX11 degron-fused EGFP protein. Source data are available for this figure: SourceData FS2.

