Figure S3.
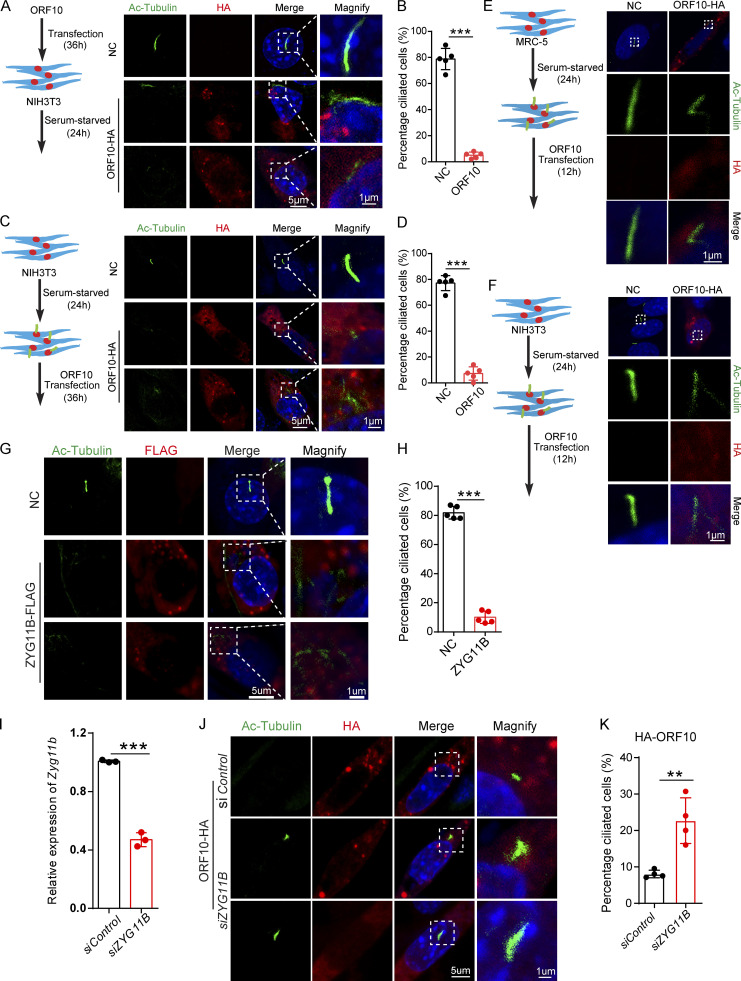
Cilia dysfunction in ORF10 expressing cells is related to ZYG11B. (A) ORF10 inhibits cilia biogenesis in mouse NIH3T3 cells. Immunofluorescence analysis for Ac-Tubulin (green) and HA (red) was performed in ORF10-expressing and empty-vector transfected NIH3T3 cells. Nuclei were stained with DAPI (blue). (B) Quantification ratio of ciliated cells in ORF10-expressing and empty-vector transfected cells (A) (n = 5 independent experiments). Data are presented as the mean ± SEM. *** indicates P < 0.001. Statistical analysis was performed with two-tailed unpaired Student’s t test. (C) ORF10 perturbs cilia maintenance in mouse NIH3T3 cells. Immunofluorescence analysis for Ac-Tubulin (green) and HA (red) was performed in ORF10-expressing and empty-vector transfected NIH3T3 ciliated cells. Nuclei were stained with DAPI (blue). (D) Quantification of the ratio of ciliated cells in ORF10-expressing and empty-vector transfected cells (C; n = 5 independent experiments). Data are presented as the mean ± SEM. *** indicates P < 0.001. Statistical analysis was performed with two-tailed unpaired Student’s t test. (E and F) ORF10 is localized in the cytoplasm of MRC-5 cells (E) and NIH3T3 cells (F). Immunofluorescence analysis for Ac-Tubulin (green) and HA (red) was performed in ORF10-expressing and empty-vector transfected MRC-5 cells or NIH3T3 cells for 12 h. Nuclei were stained with DAPI (blue). (G) ZYG11B overexpression perturbs cilia biogenesis. Immunofluorescence analysis for Ac-Tubulin (green) and FLAG (red) was performed in ZYG11B overexpressing and empty-vector transfected NIH3T3 cells. Nuclei were stained with DAPI (blue). (H) Quantification ratio of ciliated cells in ZYG11B overexpressing and empty-vector transfected cells (G; n = 5 independent experiments). Data are presented as the mean ± SEM. *** indicates P < 0.001. Statistical analysis was performed with two-tailed unpaired Student’s t test. (I) The knockdown efficiency of Zyg11b. Relative mRNA level of Zyg11b in siControl or siZYG11B transfected NIH3T3 cells. Data are presented as the mean ± SEM. *** indicates P < 0.001. Statistical analysis was performed with two-tailed unpaired Student’s t test. (J) Knockdown of Zyg11b partially rescues the ciliogenesis defects in ORF10-expressing cells (siControl or siZYG11B). Nuclei were stained with DAPI (blue). (K) Distribution of ciliated cells among ORF10-expressing cells co-transfected with vectors for expression of siControl or siZYG11B (I; n = 4 independent experiments). Data are presented as the mean ± SEM. ** indicates P < 0.01. Statistical analysis was performed with two-tailed unpaired Student’s t test. Source data are available for this figure: SourceData FS3.

