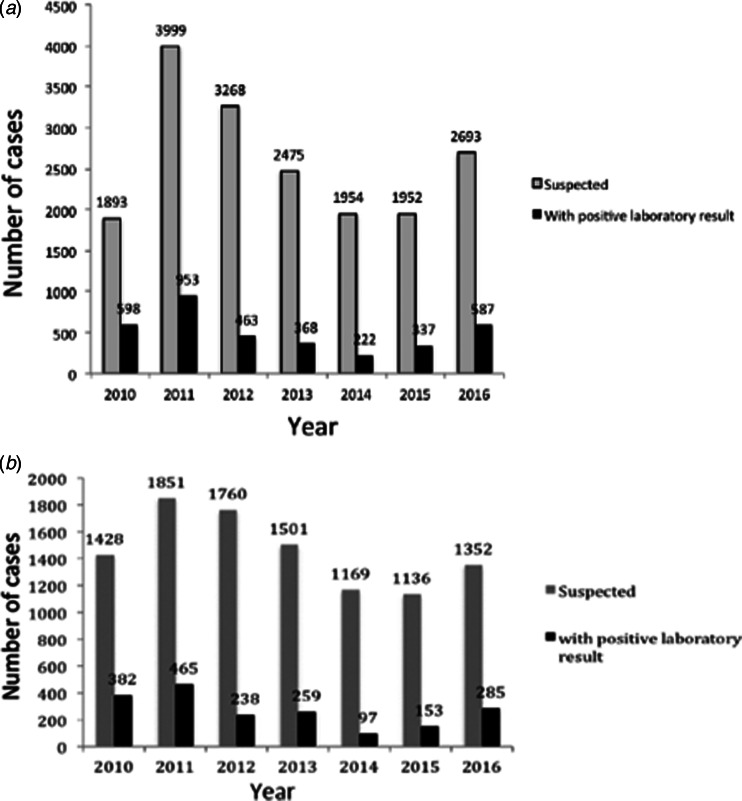
Fig. 2.
(A) Distribution of a number of pertussis cases notified at the SIVILA network per year during 2010–2016 in the Buenos Aires province. (B) Distribution of a number of pertussis cases notified by the Reference Lab per year during 2010–2016 in the Buenos Aires province. In both panels, the total number of cases per year is plotted on the ordinate for each year indicated on the abscissa. The numbers above the bars denote the precise ordinate values. Grey bars, clinically suspected cases; black bars, laboratory-confirmed cases.

